The best time to buy Bitcoin was ten years ago. The second-best time is now.
Disclaimer: Nothing contained in this article should be considered as investment or trading advice.
If it was advice (and it’s not—did you forget already?) it would be for people who’re interested in crypto but don’t know what to do about it.
Original publish date on Medium: 29 June 2020. Update 12 July 2020: Hash Ribbons Buy signal.
The short version
Several technical indicators show that the next long-term (measured in years) move up in price of Bitcoin is starting, and it will go at least ten times higher from here. The safest way to play this is to buy spot (no leverage) Bitcoin from a reputable exchange, sometime soon. Use an amount that you’re ok to lose (don’t take credit or use the rent money). Keep it safe off the exchange. Don’t sell if the price goes down. Sell some when:
- You’re dizzy with the profit and don’t want to sell any
- Long-term technical indicators say it’s time to sell
Or, keep it as an asymmetric bet on a different monetary system emerging.
Long version follows.
Fundamentals
Blockchain is here
It’s easier to list the large companies that aren’t developing blockchain projects than those who are. To pick the first two companies that came to my mind, IBM and Microsoft have built their own blockchain platforms for other businesses to build with. Although not a direct reason to buy Bitcoin, this is representative of a shift in the way business is done that is likely to have an impact like the internet did. If anyone remembers what life was like before the Internet.
Cryptocurrencies are coming
Samsung, the world’s biggest smartphone manufacturer, ships its new phones with the ability to store, buy and sell cryptocurrencies built in. Starbucks, a small coffee shop, is testing accepting Bitcoin and other cryptocurrencies as payment via its own mobile app. They are not ready for widespread use this month or maybe even this year, but cryptocurrencies are coming.
Bitcoin is not dead
Despite daily hacking attempts, regular negative press attacks, and being pronounced dead 381 times, Bitcoin has better usage metrics than ever.

Bitcoin as an investment asset
Alright, but why would anyone buy Bitcoin specifically as an investment?
Bitcoin is hard money
Born in response to the 2008 financial crisis and the money-printing that followed it, Bitcoin is deliberately non-inflationary. As central banks print huge amounts of promises, people are concerned about protecting themselves from incoming inflation. This will drive them to gold and Bitcoin.
Short article by me about hard money.
Long video by economics professor Saifedean Ammous about hard money (which is clearly where I ripped off the idea from).
Institutions are buying crypto
Big funds have rules that allow them to buy stocks and ETFs and other regulated assets. They have not been allowed to buy crypto up till now. This has kept a lot of money out of the market.
But investment-grade products are becoming available. Grayscale, for example, has bought $3.6 billion of Bitcoin, which investors can get exposure to via GBTC shares.
Billionaires are recommending Bitcoin
If you want to make money, don’t ask advice from an economist with a mortgage, or a financial advisor who still has to work 9–5 in an office. Ask a really f***ing rich guy. Not all of them like crypto, but some have started stating their support in no uncertain terms.
Gold is the protection of our assets. Bitcoin is the call option on the future system.
Raoul Pal, The Unfolding report for hedge funds, April 2020
At the end of the day, the best profit-maximizing strategy is to own the fastest horse … If I am forced to forecast, my bet is it will be Bitcoin.
Paul Tudor Jones, investor memo, May 2020. News. Full text.
Bitcoin is a very binary investment — it either goes to zero or millions.
Chamath Palihapitiya, interview, April 2020
I don’t think he’s a billionaire, but no collection of quotes about Bitcoin would be complete with this from the founder of McAfee Antivirus, made 17th July, 2017, when the price of Bitcoin was $2,200:
If 1 Bitcoin isn’t worth $500,000 in 3 years, I’ll eat my d*ck on national television.
John McAfee
As we’ll see, he’s probably right about the price, but off by several years.
It’s been doing pretty well so far
Why now?
The Bitcoin price is not particularly low right now, so why would now be a smart time to buy? For an investor/trader with a long time horizon, you want to catch the big cycles and ignore the noise. Let’s look at some tools to analyse these big cycles.
There are lots of other long-term Bitcoin indicators and metrics, but the following ones seem to me the most interesting and exact.
The Halving
Yes, it was spammed a bit much in the news, but it is important. Every four years or so, the reward for mining Bitcoin (symbol: BTC) gets cut in half. This reduces the rate of supply and should therefore, assuming constant or increased demand, make the price go up. Here’s how that worked out so far:
- Halving 1, 28 Nov 2012. BTC price: $12.21
Highest price in next four years: $1155 (+9,600%)
Lowest price in next four years: $12.10(-1%) - Halving 2, 9 July 2016. BTC price: $646
Highest price in next four years: $19,600 (+3,000%)
Lowest price in next four years: $465 (-28%) - Halving 3: 12 May 2020. BTC price: $8,828
So we’ve just started another 4-year period. Because there are so few data points, the Halving on its own doesn’t give us much help in the way of prediction. It does say two things though: the lowest price in the next four years should not be much lower than $8,800, and the highest price should be a lot higher. How much higher? We can look to precious metals for an example.
Stock-to-flow
A commodity’s stock-to-flow ratio is a way of quantifying how scarce something is. Gold is especially scarce, in this analysis, because the new gold mined each year is very small compared to the amount of above-ground gold. And because it’s very hard to increase the rate of mining, gold has very low price elasticity of supply. This kind of scarcity is “unforgeable costliness” and it equates to high value. The higher the stock-to-flow ratio, the more expensive something is, more or less. The original examination of stock-to-flow and Bitcoin by PlanB predicted a top Bitcoin price of $55,000 in this current Halving cycle that started in May 2020. The updated analysis includes stock-to-flow ratios of gold and silver and predicts a top Bitcoin price of $288,000 in this cycle.
So that gives us some very rough ideas how high it might go. But we can do better.
Bitcoin’s logarithmic growth curve
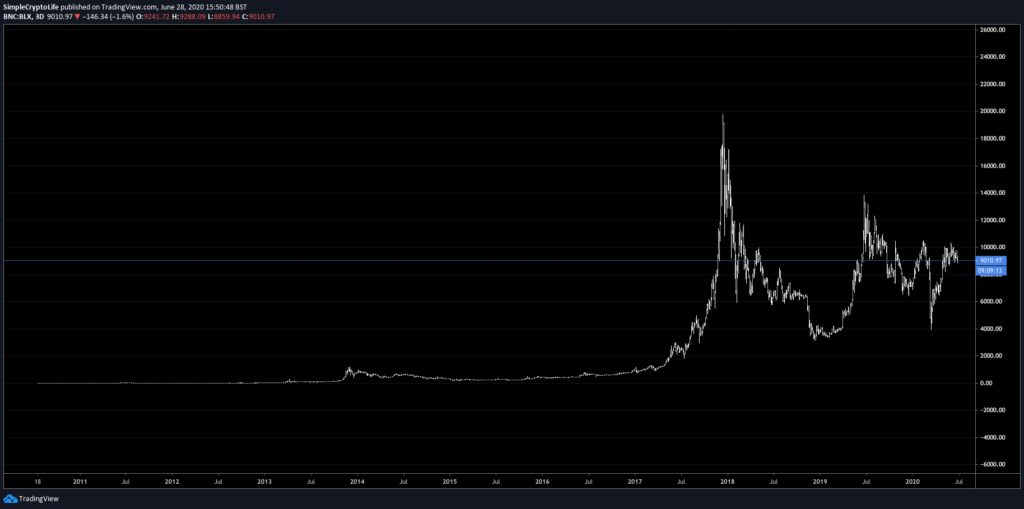
The price growth of Bitcoin doesn’t make any sense when you look at it on a chart:
Like, what is that? Nothing nothing nothing then crazyness. The key is realising that it’s an exponential asset. It’s growing according to power laws, apparently, and maybe a mathematician can tell me what that means in the comments. What I do know is that if you plot logarithmic price against logarithmic time:
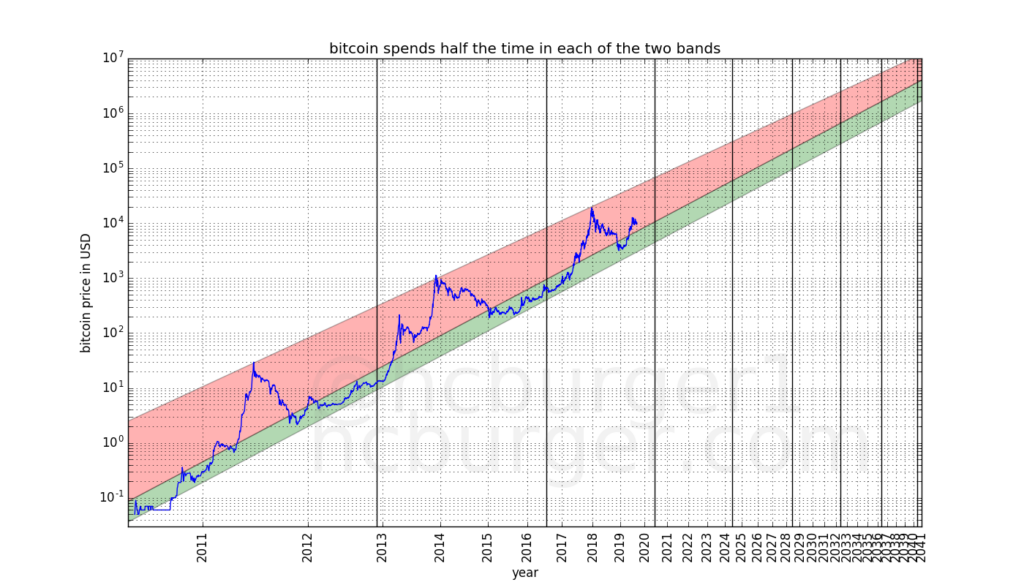
It suddenly becomes a straight-line channel. And in theory much more predictable.
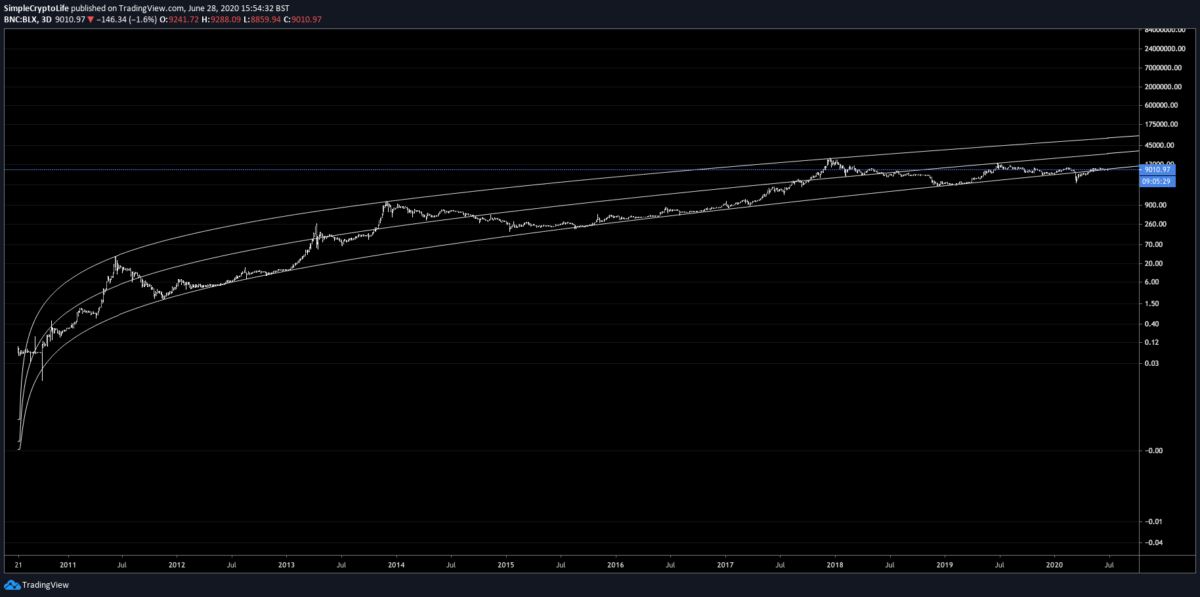
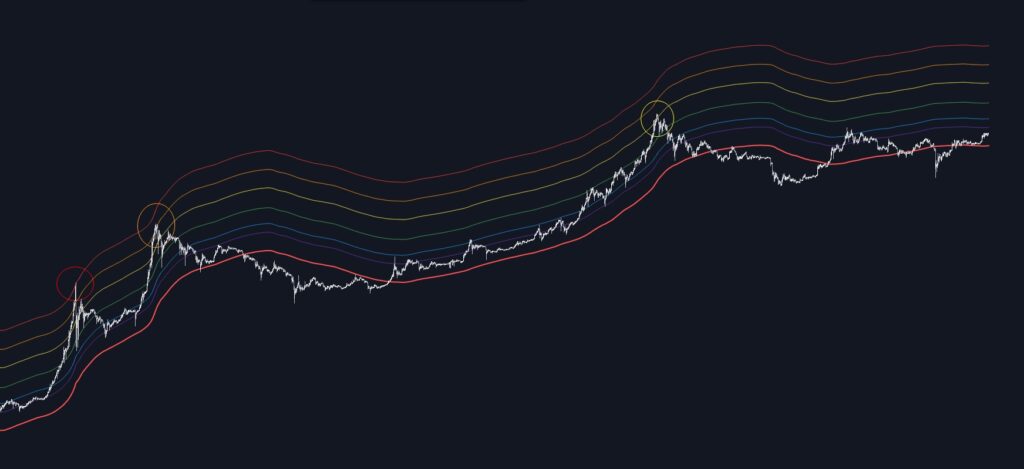
Normal trading stations can’t plot log time. But if you plot logarithmic price against linear time, and plot log price curves, you get an approximation:
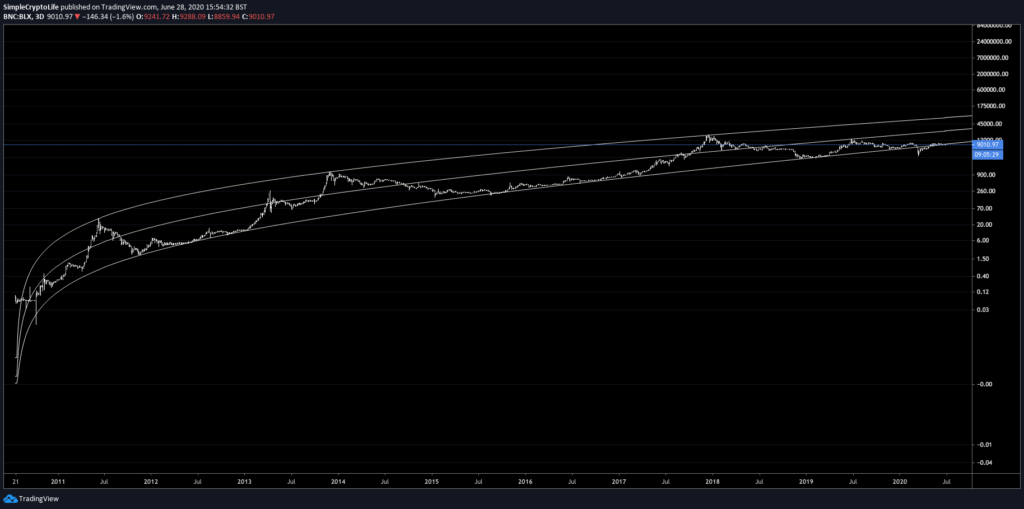
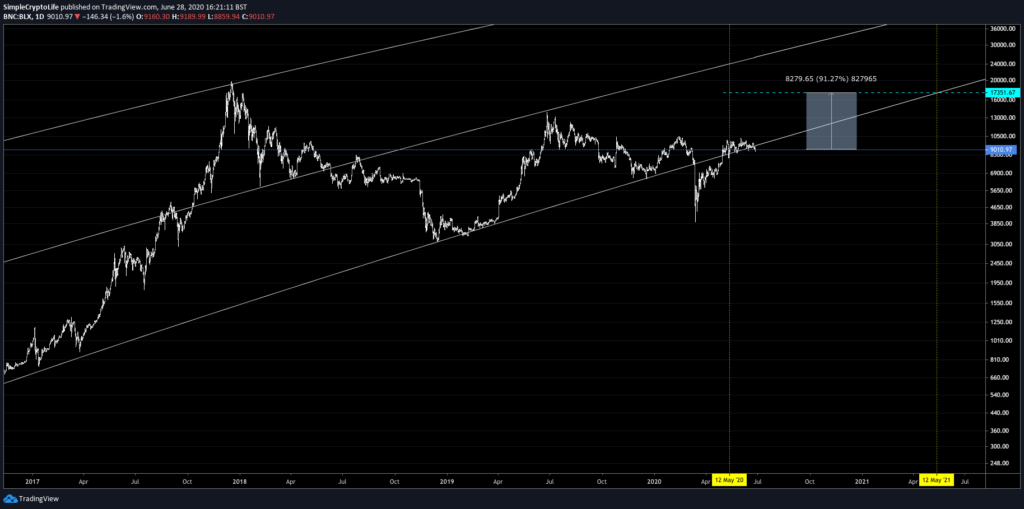
In theory, when the price approaches the bottom line, it’s a good time to buy. And the top line, it’s a good time to sell. Let’s zoom in on the present day:
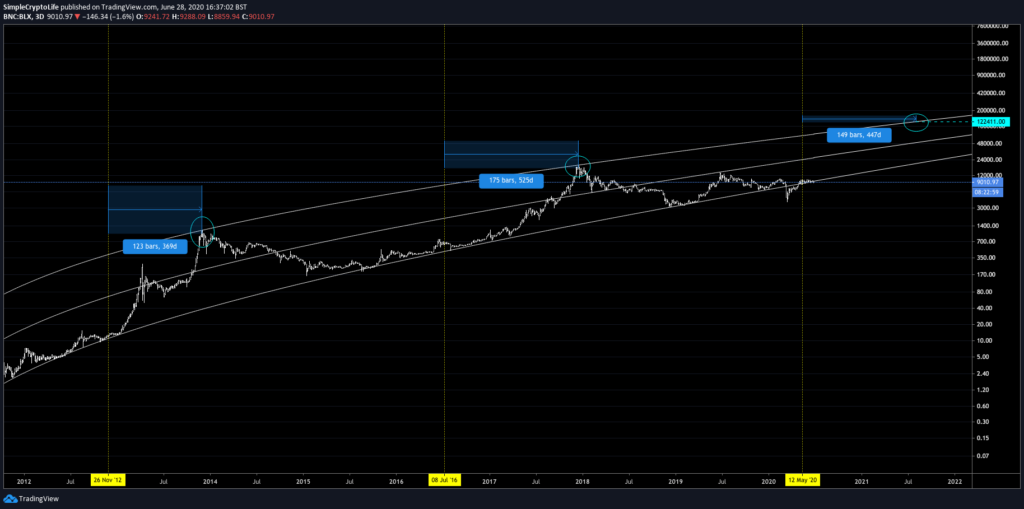
What does this tell us? Firstly, the Everything Selloff in March 2020 looks like an anomaly, taking Bitcoin as it did swiftly into undervalued/oversold territory according to the log/log theory. Secondly, now is still a good time to buy, because price is at the lower end of the channel. Thirdly, this model would predict a minimum price of around double current prices in a year’s time. The maximum price depends on how long it takes to reach the next peak. Let’s take an educated guess at that:
From the first and second Halvings to the next macro peaks took 369 and 525 days respectively. If we take those figures and plot out where they would hit the upper log curve, the next top would be between $111,000 and $135,000. Higher if it takes longer.
Golden Ratio and the Pi cycle
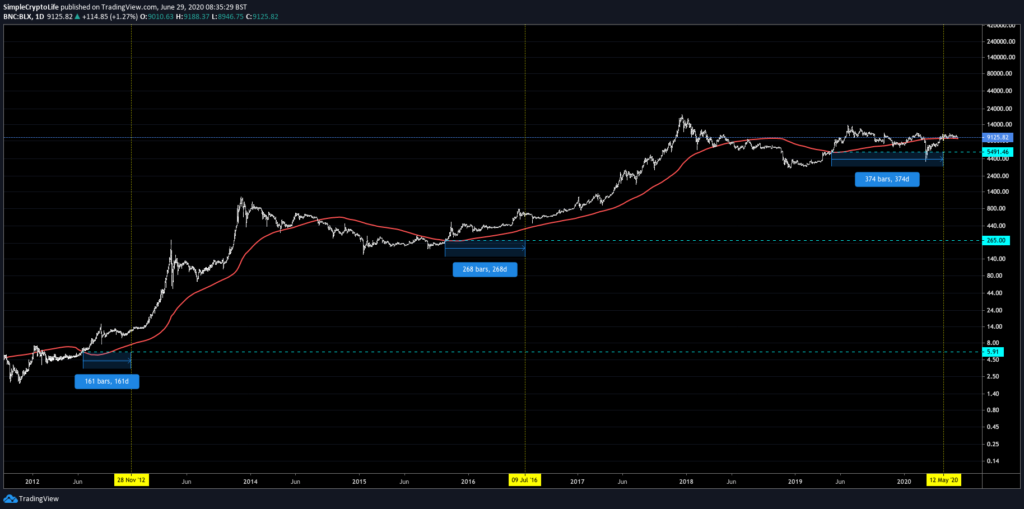
A moving average is the average of all values up to now. For example, a 10-day moving average takes all values from the close of the last 10 days and calculates the average.
The great article The Golden Ratio Multiplier by Philip Swift (@PositiveCrypto) shows us that the 350-day Simple Moving Average (SMA) seems to fit Bitcoin very well. When price crosses the 350D SMA up, this signals the start of the next big run up.
If we multiply this moving average by some Fibonacci numbers, we get all sorts of interesting properties. When price hits:
- 350D SMA x 21 = the peak from 2011
- 350D SMA x 13 = the peak from 2013
- 350D SMA x 8 = the peak from 2014
- 350D SMA x 5 = the peak from 2018
- 350D SMA x 3= the next peak ?
- 350D SMA x 2= the peak after that?
Additionally, 350D SMA x 1.6 and x2 are intra-cycle support/resistance where you might want to take profit and rebuy lower.
Lastly, crosses of the 350D SMA x2 below another daily moving average, the 111DMA, have historically timed the peaks of Bitcoin’s price to within 3 days.
What’s the significance of these numbers? 350/111 is 3.15, which is the closest we can get to Pi, starting with 350. Woo. Cosmic, man.
How does this help us now?
The two previous times that price definitively crossed the 350-day moving average up, it never got that low again. This latest time, however, the low was broken by the Everything Selloff, which again seems to be an anomaly from a technical analysis point of view. Price quickly climbed back above that level ($5,500), and the 350-day moving average, and barring another global selloff, should stay above it until the next peak.
Puell multiple
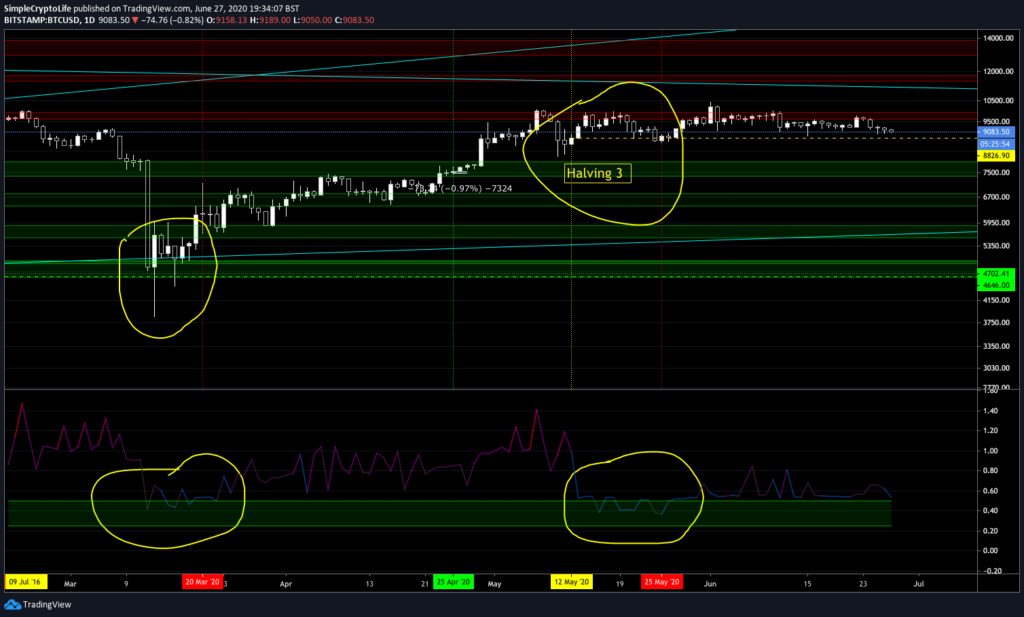
The Puell multiple is the ratio of the mining revenue from the Bitcoins mined on a particular day to its yearly average. This shows whether Bitcoin is cheaper or more expensive than “average”, and picks tops and bottoms in long cycles very well. Explanation of Puell Multiple by cryptopoiesis.
Now, different implementations of the Puell Multiple give slightly different results. But by any reading, we had a period where the multiple was very low (meaning it’s a good time to buy), in the first weeks of this Halving cycle.
In this chart you can see I’ve highlighted that according to this metric, the flash crash on March 2020 was a good time to buy (duh! If you had the balls), and also just after the Halving, when the price was around $9,000. Remember that this metric isn’t just measuring price, but using blockchain metrics as well to take a long-term view.
Hash ribbons
Bitcoin miners have to sell most of the Bitcoin they mine to pay for their huge costs of equipment and electricity. This makes them one of the main sources of supply in the open market and hence a major driver of price.
When the block reward drops after a Halving, the miners suddenly have half the income. They all start to sell some of their saved stash of Bitcoin to break even, each betting that they can outlast the others. This pushes price down, making them all less profitable and and accelerating the process.
The less efficient miners struggle, and soon go out of business (capitulation). When enough mining power (hashrate) has been taken out of the game, the difficulty of mining Bitcoin automatically readjusts (she’s clever like that), and the relative reward for each miner increases to the point where all remaining miners are profitable again. They no longer need to sell and would rather hoard their Bitcoin. Buyers start to outnumber sellers, and prices rise. Article about block rewards and miner capitulation.
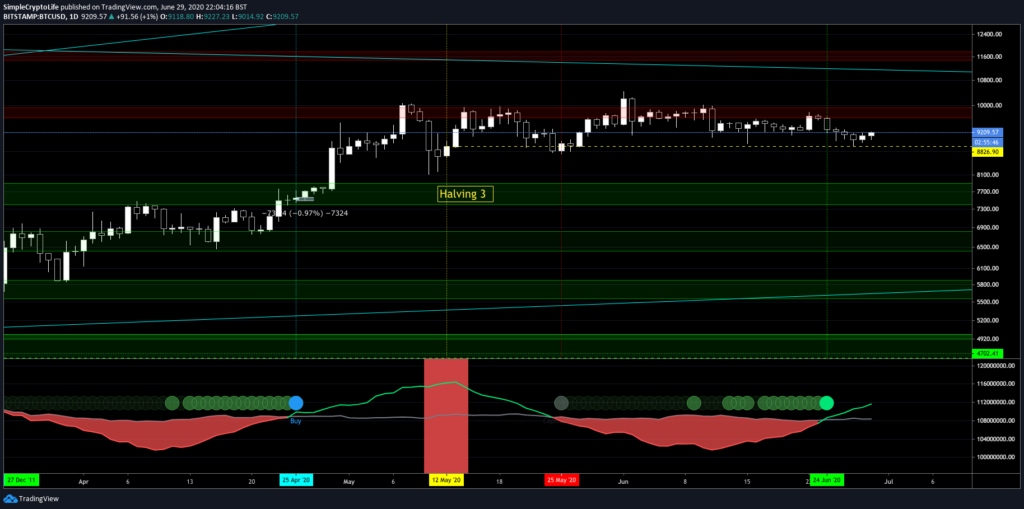
Because all miners are using all their resources to mine as much as they can, all the time, a large drop in the hashrate is a tell-tale sign that someone has taken their hardware offline. To be sure, you need to wait until the hashrate starts to increase again, showing that the remaining miners are picking up the slack. A simple moving-average crossover strategy seems to work remarkably well here.
The following analysis lists all buy signals from the Hash Ribbons indicator by capriole_charles, along with the maximum drawdowns and the peak price from that Halving cycle. This Hash Ribbons indicator uses some simple confirmation that price is also going up after the hash rate recovers.
- Buy signal, 27 Dec 2011. BTC price: $4.30
Lowest price ever after that: $3.80 (-11.6%) - Buy signal, 11 May 2012. BTC price: $4.95
Lowest price ever after that: $4.89 (-1.5%) - Buy signal, 22 June 2012. BTC price: $6.59
Lowest price ever after that: $5.99 (-9%)
Halving 1, 28 Nov 2012
- Buy signal, 4 Feb 2013. BTC price $20.34
Lowest price ever after that: $20.08 (-1.3%)
Macro top: $1155, 30 Nov 2013
- Buy signal, 28 Jan 2015. BTC price: $236
Lowest price ever after that: $197 (-16.6%) - Buy signal, 2 May 2015. BTC price: $234
Lowest price ever after that: $197 (-15.3%) - Buy signal, 15 June 2015. BTC price: $236
Lowest price ever after that: $197 (-16.1%)
Halving 2, 9 July 2016
- Buy signal, 30 Aug 2016. BTC price: $577
Lowest price ever after that: $566 (-1.6%)
Macro top: $19,600, 17 Dec 2017
- Buy signal, 11 Jan 2019. BTC price: $3632
Lowest price ever after that: $3315 (-8.5%) - Buy signal, 27 Dec 2019. BTC price: $7254
“Natural” lowest price after that: $6907 (-4.8%)
Actual lowest price (Everything Selloff): $3833 (-47%) - Buy signal, 25 April 2020. BTC price: $7548
Lowest price since then: 7481 (-1%)
12 May 2020: Halving 3
- Buy signal, 12 July 2020. BTC price: $9255
What does this mean historically? Hash Ribbons have been a very good buy indicator. The maximum drawdown (before 2020) was 17%, and the average drawdown was only 8%. The Everything Selloff screwed with this indicator, as with many others, giving a maximum drawdown of -47%.
What does this mean for us right now? Well, we normalised after the crash, and had another miners’ capitulation caused by those low prices. Then another one caused by the Halving, as expected. That was duly followed by a righting of the hashrate on the 24th June 2020. We’re currently expecting a full Buy signal any day now [Update: we got one 12 July]. But that’s just personal preference of price performance. The on-chain metrics have given a green light to buy.
Summary of buy indicators
- The Halving: Buying on or shortly after the halving (the most recent one was 12 May 2020) has historically given outstanding returns.
- Stock-to-flow: The top in this cycle could reach $288,000.
- Log growth curves: Price is at the bottom of the channel at the time of writing. Buy low, sell high. Which is likely to be above $111,000.
- Golden Ratio: We started another bull cycle at $5,500.
- Puell Multiple: Around $9,000 is a good price to buy for the long term.
- Hash Ribbons: Buy signal at $9255. Under normal circumstances we’d not expect a drop lower than $7500 from here, and it might not drop at all.
When to sell
The psychological point is real: when it comes time to sell, you won’t want to. From a technical point of view, this is what the indicators we’ve looked at have to say:
- The Halving: The next peak is likely to be sometime in the next two years.
- Log growth curves: Sell when price approaches the upper bound of the log channel.
- Golden Ratio: Sell when price hits the 350-day Simple Moving Average x 3.
- Pi Ratio: Sell when the 350-day SMA x2 crosses below the 111-day SMA.
- Puell Multiple: Sell when the Puell Multiple hits about 7.
All of these indicators are available on TradingView for free. I might make my own simpler-to-use one that includes them all. Follow me on TradingView or sign up at the bottom of this page to get notified of indicators I release. If you don’t have a TradingView account, you can use my link to sign up, or just go to tradingview.com.
Risks
This theoretical trade has several risks, including but not limited to:
Another crash
The Everything Selloff took the Bitcoin price outside the bounds of several of these indicators. Could it happen again? While Bitcoin should flip from a risk asset to a safe haven, there’s no telling when that might happen. So, yes we could get another crash. This is a risk only if you use leverage (don’t do that), or panic-sell if the price goes down (don’t do that either). Remember that price came back up again very quickly.
Crypto dies
Maybe something technical and bad happens to the Bitcoin code. Maybe banks kill it, or governments successfully and lastingly outlaw it.
Fire, theft, and third-party
If you lose your private key/password, or the exchange gets hacked, or your computer gets hacked, your funds can get stolen or become inaccessible.
The future doesn’t resemble the past
All of these models make pretty strong predictions. There’s nothing that says Bitcoin has to continue to behave the way it behaved in the past.
Are you taking this trade?
Sort of. I’m holding spot Bitcoin already. I’m using it to trade altcoins to try to accumulate more Bitcoin. I’m not sitting in USD waiting for Bitcoin to fall, because I believe, long term, it’s going up, for the reasons I’ve been talking about. I also bought spot Ethereum just before (d’oh!) and during (balls) the Flash Crash, because if Bitcoin succeeds it will drag Ethereum with it, and it will likely outperform.
How to buy and store Bitcoin
Never Google for anything to do with crypto; you’ll get scammed. Start on a trusted site like coinmarketcap.com. Bookmark everything.
There are lots of exchanges where you can buy Bitcoin. Binance is probably the best one right now. You could use my link to open a Binance account, or just go to binance.com.
If you’re keeping Bitcoin for a long time, keep it off the exchange, on a hardware wallet. I think Ledger are still the best.
Thanks for reading. Have fun and good luck!
Postscript
Weiss Ratings is a serious outfit. Their crypto division published this just one week after I first published this article: https://weisscrypto.com/en/article/3-big-reasons-to-be-bullish-on-bitcoin
#bullish #goodcompany
🌍 Share this:
Want more to read? Here are my latest articles:

