
What it does
- Shows you when a counter-trend is starting
- Gets you into trends with minimal lag
- Helps you take higher-return trades
- Makes it easy to trade using multiple timeframes (like the pros)
This is a unique indicator that combines momentum and price metrics with market structure (She Who Must Be Respected) in one intelligent, flexible tool.
Why it’s great
It’s great because it:
- Catches every significant move.
- Helps you to trade trends, which is the most profitable way to trade.
- Has intelligence built in to avoid problems that face other indicators.
- Stops you getting rekt by shorting uptrends and longing downtrends
- Is an advanced tool that can also be used in easy mode.
How it works
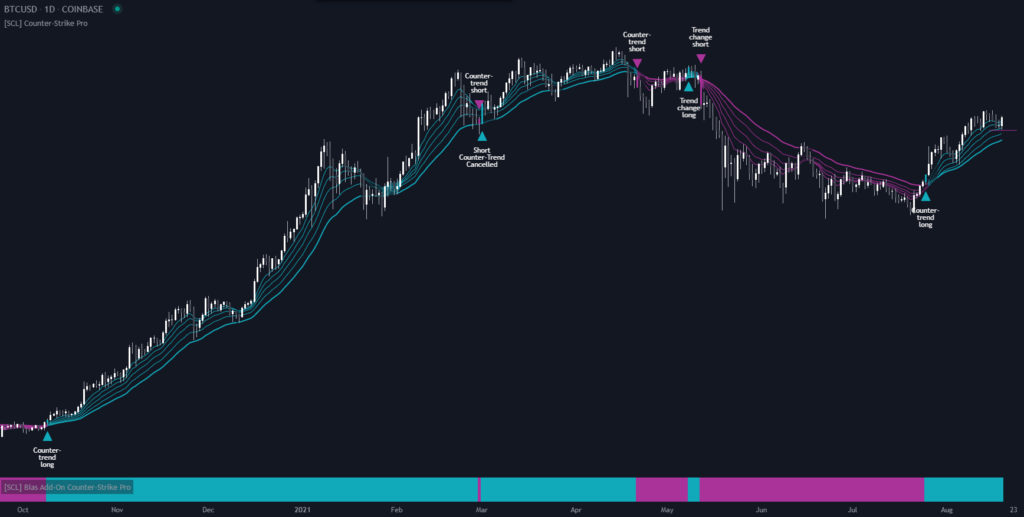
When momentum is aligned across different metrics, Counter-Strike Pro then looks for market structure to be broken. I call this a Momentum Failure Pattern (MFP). It’s a counter-trend signal, an early indication that the trend is changing direction.
Versus pure market structure
I wrote what is probably the definitive market structure indicator on TradingView, which is free. Why not just use that or a similar indicator? Because interpreting market structure strictly according to the rules means that you can end up being short when you should be long, and vice-versa. It can also chop you out of your bias unnecessarily. Let’s look at the most recent run up and eventual (intermediate) top of Bitcoin as an example. In the following chart, the main background colour is long/short bias from True Market Structure, and the bar at the bottom is from Counter-Strike Pro, both indicators using default settings (but some display options off for clarity).
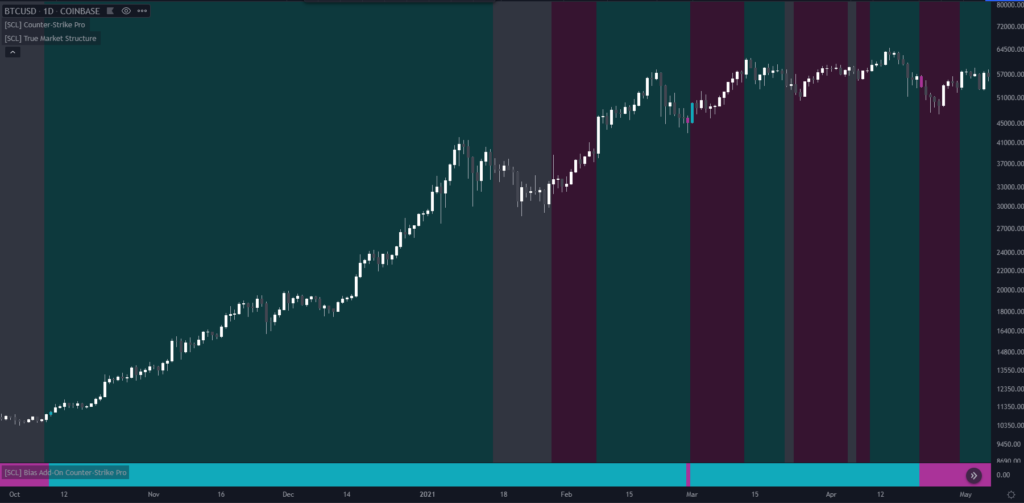
You can see that while (necessarily) they agree on some inflection points, Counter-Strike Pro kept you in the uptrend much more consistently. Strict market structure, on the other hand, was actually bearish while price was recovering and going up. This is because Counter-Strike Pro chooses which levels to watch based on momentum, and then updates those levels, instead of just taking the most recent Local Lows and Highs. This is why it’s also better than other simple price-based indicators like Williams Fractal Trailing Stops, Heikin-Ashi flips, or ATR-based ones like Supertrend. Every trend indicator looks at least a little similar to every other one, because anyone can recognise a trend eventually – but the EDGE is in getting in early without too many false positives (i.e. not too early), and staying in without being shaken out unnecessarily. Being a couple of bars late can be the difference between a profitable and unprofitable trade.
Versus moving averages
Counter-Strike Pro includes a configurable set of moving averages. The flow of these MAs is used as a supplementary input to determine trend direction. Sometimes market structure breaks first, and sometimes the “lagging” price averages flip first, and this indicator takes both into account and sorts out the long/short bias for you. This makes it superior to purely moving average cross- or flow-based indicators. I’m not saying those indicators are bad; they’re not (especially for free), but I think the hybrid approach here performs better.
Here’s an example of one of the most popular moving-average based indicators versus Counter-Strike Pro (both default settings). For much of the time they have the same opinion, because they can both read uptrends and downtrends. I’m not showing the part where they agree. Here I picked an instance where mine looks best and the other one looks worst, just to illustrate the dangers of relying solely on lagging indicators. I encourage you to do your own testing.
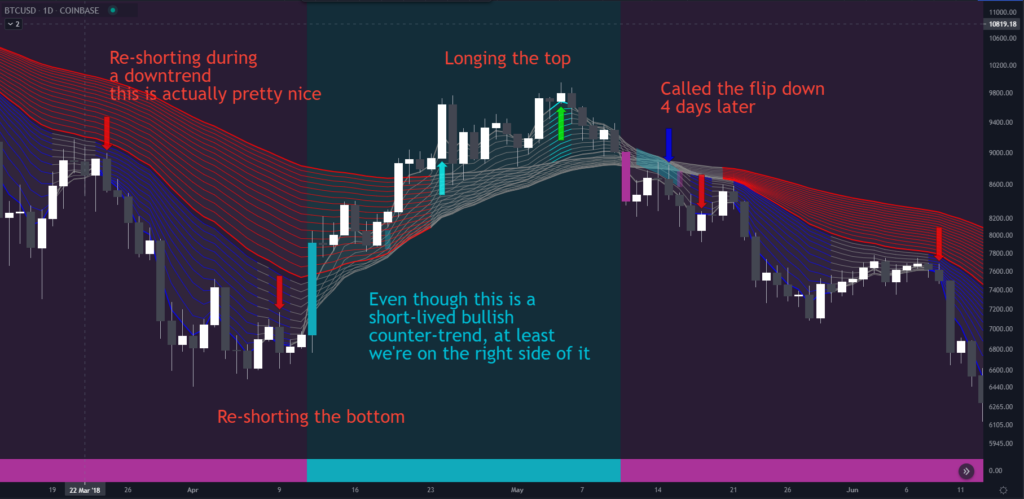
In the chart above, arrows are trend changes according to the moving average-based indicator, background colour shows the bias from Counter-Strike Pro, and candle colour shows its signal candles. The point is not that we did better in this one cherry-picked case. If you look closely you can see why we did better – because a certain price level was broken each time, way before the moving averages caught up.
Versus momentum
I’m reliably informed that even the humble RSI can become a complete and formidable trading system – if you learn it well enough. And it’s free. And there are many other momentum indicators. Momentum is a leading measure, which means that if you master it, you can anticipate moves before they happen. But you can also get mislead very easily. For example, if you exited a bullish trend each time you got a “bear” divergence, you would miss out on most of the move. The difficulty is that you need to spend the time to get a certain level of skill and experience in order to use momentum indicators properly. While Counter-Strike Pro does reward a little investigation, it is easy to use out-of-the-box.
Limitations
Counter-Strike Pro catches every big move, because it catches every significant move. The price for that is that it gets faked out sometimes in choppy markets, which all trend indicators do. There is a lot of intelligence built in so that it gets chopped up as little as possible.
The indicator can’t make the market trend nicely; it can only try to find and interpret trends and countertrends. Especially, just because a countertrend starts does not mean that it will continue. By no means all countertrends mark trend-changing tops and bottoms. However, this indicator will increase your odds of catching them.
On “selling the top”: Trend indicators in general don’t signal trend changes quickly at the top of parabolic tops. Counter-Strike Pro will not, for example, call the Bitcoin top on a daily scale, because price is moving too fast to make proper market structure. Such blow-off tops are inherently unpredictable, and I don’t know of any indicators that will do this reliably without false positives, although I am working on one that does surprisingly well.
It will, however, if used correctly, prevent you from making the common mistake of wrongly anticipating a top and shorting a strong uptrend or longing a strong downtrend, both of which are lethal for a trader’s profitability.
It works best on liquid assets that trend neatly, such as Bitcoin or high marketcap altcoins. It does not work well on volatile assets that spike a lot as they are trending, such as precious metals. It needs a certain amount of history, so will not work well, if at all, on very new assets. It works surprisingly well on the crypto marketcap charts. Different assets might require different fractal settings. For example, very smooth Forex pairs that don’t form many Williams fractals might require smaller fractal ranges. You need to go through the history and check.
Technically, it works on all timeframes, however, the considerations about volatility apply even more to lower timeframes. Traditional assets that can gap up or down present a particular problem for trend indicators.
How to trade with it
This is not a tool for complete beginners. You must already know how to take profit, how to set stops, and how to do trade and risk management.
It gives a high-timeframe bias, and it gives entries with a high potential risk:reward ratio. And that’s enough to improve your trading.
The better you understand trend trading, the more you’ll get out of this indicator. Ideally you would use it to make your own trading system more robust, or create a trading system around it.
There’s no point asking trading advice from me, as I’m not an especially skilled or knowledgeable trader; rather look up the people I recommend in Who To Trust. The following is just general advice on using this particular indicator.
Entries
You can use any signal as an entry: trend flips, Momentum Failure Patterns, or MFP cancellations. The normal rules of trading still apply, including using confluence. Good old support and resistance, as well as trend lines, can be very useful in helping you decide if you want to take a particular signal or not. You as the trader decide whether and how to trade on a signal from any indicator.
Exits
Where and how to take profits is entirely up to you and your strategy. You can use a counter-signal as an exit, if you want.
With anything shorter than 2,4 fractal setting (see the Settings section for more details), you might use a recent Local High/Low as the initial stop. With 2,4 or higher, you also have the more aggressive choice of using the signal candle Low/High for stops, with a small buffer for scam wicks. Whether and how to use a trailing stop is again up to your strategy.
Multiple timeframes and bias
Counter-Strike Pro actually comes as a pair of indicators. Counter-Strike Pro displays on the main chart. The other one displays in a separate pane and is called “Bias Add-On for Counter-Strike Pro”. It allows you to do something very cool: to get the long/short bias from a higher timeframe, on the same chart.
Here’s how to do it:
- Add the indicator to your chart by pressing the
/(forward slash) key and searching forBias Add-On for Counter-Strike Proin theInvite-only scriptssection of theIndicators & Strategieswindow. It appears in a separate pane underneath the main chart. It does not display signals, but only the background colour that shows long/short bias. - Hover over the indicator name on the left hand side and click
Settings(the little cog). You can adjust any of the colour and advanced settings, which are identical to those in Counter-Trend Pro. - Change the indicator Timeframe, which is the first setting, to be a higher timeframe than the main chart. There’s no point in selecting a lower timeframe, because all it will do is run the script on the last e.g. 5-minute bar of each 1-hour segment, which is pretty random and not useful.
- Adjust the size of the pane to suit your layout. I like to make it smaller than the default size, since it’s only showing colours.
TradingView for some reason doesn’t colour the whole background in. It colours a single stripe at the end of the time period. It doesn’t give the live state of the current period – and I’ve also seen a stripe missing here and there in testing. This is behaviour of their framework, not my script, so please don’t ask me about any occasional oddities of this particular type as I can’t do anything about it. Nevertheless, it works just fine almost all the time. Here’s an example of this month’s Bitcoin price action with 12H bias on a 2H chart:
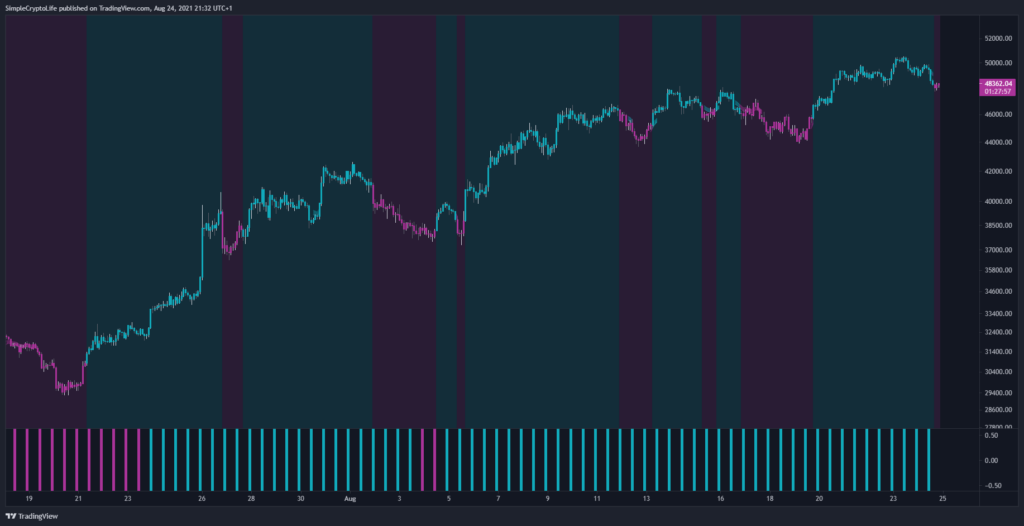
Why would you do this? Because it gives you a look at how price is trending at a higher timeframe, which is in a sense more powerful than the timeframe you’re currently looking at. If bias has just flipped long on the 1D chart, and you’re working on let’s say the 1H, you would be well advised to look for longs rather than shorts. It doesn’t mean that your longs are guaranteed to work out, but the odds are more on your side.
In the example above, under a 12H long bias you can clearly see that 2H longs tend to work out better than shorts. They run further, get stopped out less often, and are just easier trades.
In an uptrend, look for longs. In a downtrend, look for shorts. Simple to say, and, with this setup, now also simple to stick to.
Advanced
Some thoughts on advanced usage.
MFP signals only
Advanced traders might not want to use the trend features at all, but the Momentum Failure Patterns can be useful for pulling the trigger on a setup that you’ve derived from your own technical analysis. For example, price rises into resistance, a supply zone, or a range high and you are looking for a rejection and a short entry. You can watch the price action unfold, or you can just set an alert for an MFP on the appropriate timeframe and do something else.
MA compression
An early version of Counter-Strike Pro used moving average compression, where the lines scrunch close together, as input to a signal. The finished version does not use it for signals, but I kept it in to display to traders. MA compression can precede larger moves. You can highlight compression independently of other display options.
Late HTF entries
If you get a high timeframe (HTF) bias flip, your active timeframe will already have given a signal some time ago. You can enter straight away, basing the trade off the HTF. If you don’t happen to be awake at midnight, however, price might already have run some distance in your direction. If you wait for the next new signal on the lower timeframe you might be waiting a long time. In this case you can drop to a much lower timeframe than normal to get a signal, or use something like a Heikin Ashi colour change (I wrote a neat, free Heikin Ashi script you can use).
Early HTF entries
If you want to frontrun the HTF bias flip, you can use a two-pane layout and add Counter-Strike Pro on both panes. Unlike using the bias indicator, this will give you an idea of how close the HTF is to flipping. Click the Select Layout button at the top left of the TradingView toolbar and choose a two-pane layout, as shown below.
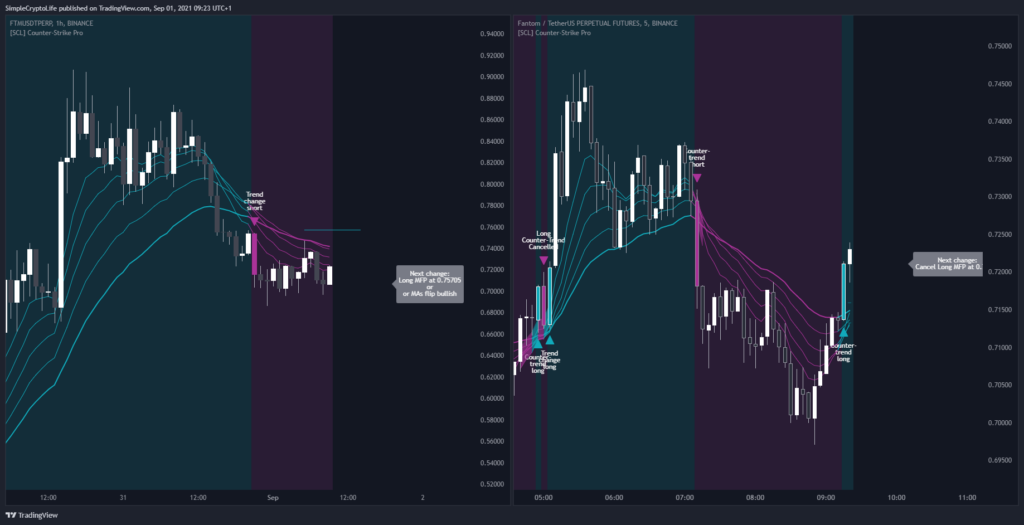
I’m not suggesting this is a great trade, but just an example of how it looks to use two timeframes. On the left is a 1H chart, and you can see the bias is short, but price appears to have found a bottom for now, the MAs are levelling out, and a bias change from short to long is not far away. You might then choose to take the Counter-Trend Long signal on your chosen active timeframe, which here is 5m. If you did, you’d be fully aware that this is a frontrunning of the change you expect to see on the higher timeframe (but which may or may not materialise). If you really want to go down the rabbit hole you could zoom out and see that the current short bias on the 1H itself is taking place within a larger upmove and that bias is long on higher timeframes like the 1D. The easiest use of Counter-Strike Pro is to take higher-probability trades that go with the higher timeframe. If instead you use it to frontrun trend changes, this is higher risk, higher potential reward (because you can use tighter stops), and you need some skill and experience not to get lost.
Live candles
Until the current candle closes, all calculations based off the Close will change dynamically. But this indicator does not repaint.
Momentum Failure Pattern candles themselves, especially at higher timeframes, can often be big moves, because they are breaks of meaningful levels. Therefore, another advanced technique is, rather than waiting for the close, to enter live as soon as the level breaks with tight trade management.
Moar timeframes
If your TradingView plan allows you to have enough multiple concurrent indicators, you could stack Bias Add-Ons from different timeframes. It is quite special to have the opportunity to see easily at a glance in one chart how each timeframe that you care about is trending. It might look something like this:
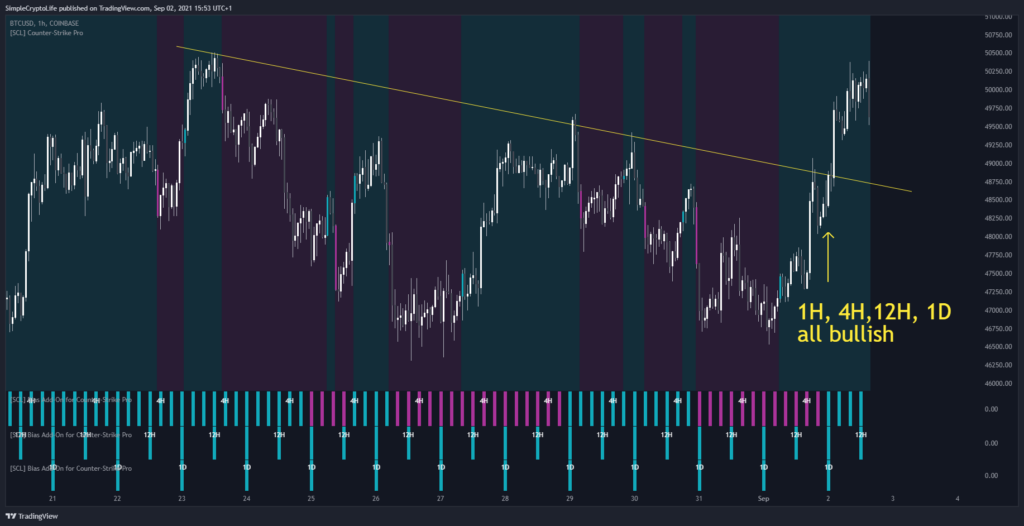
You can see that the third time that all four timeframes aligned, price managed to break through the downtrend line it had been flirting with. It’s a bit more complex than more timeframes = better, but it can be good information for advanced traders.
Predicting a bias change
Counter-Trend Pro has one feature that I think is probably unique for a trend indicator: it shows at what price an MFP will happen to flip the trend. Most trend indictors will just tell you that a change has happened. This one shows you on the chart what has to happen for a change to trigger.
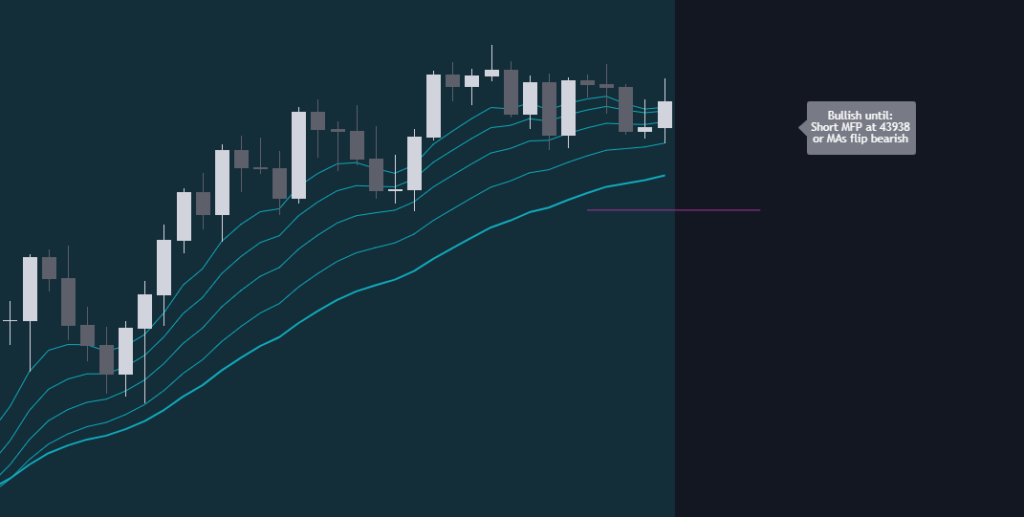
It’s important to understand that the indicator has no opinion about whether a bias change is likely or whether price will go up or down. It cannot predict the future! It’s just telling you that in order for the bias to flip bullish or bearish, some condition or other has to come true first.
One way to look at this is that if you as the trader think that the necessary condition doesn’t look likely (maybe the line is far away or the MAs are not close), then an immediate change in trend is unlikely. This doesn’t mean that an immediate change in the direction of price is unlikely, just that the indicator won’t consider it to be a trend change unless and until the stated conditions (which update dynamically) are met.
Another consideration is that because these levels are derived from local lows/highs, they can act as support/resistance, so be aware that price spiking into a level and then getting rejected can be a sign of strength of the current trend!
Settings
These are all the user-configurable settings and what they do.
BIAS AND SIGNALS
Show signals– Displays the name of the signal above/below the bar where it happened.Signal Display Mode– This mode controls how signals are displayed. You need to check theShow signalsbox in order to display them, no matter which mode is selected.Simple– Shows only bias flip events, where the indicator flips from being biased long to short and vice-versa.Normal– Distinguishes between these types of signals:Counter-trend– Momentum Failure Patterns. These are by definition counter-trend signals because they occur during contrary MA flow.Counter-trend cancellation– Momentum Failure Patterns time out after a certain number of bars if they are not confirmed by the MA flow or if price action goes strongly against them. You can also think of these signals as trend resumption.Trend change– Changes in MA flow that indicate a change in trend.
Hardcore– Shows only Momentum Failure Patterns and cancellations. You can use the candle colour, background colour, or EMA colour options to show the trend, or you can use your own analysis or other indicators.
Candle Colour Mode– Colours the candles according to the mode:BiasFlipsOff
Moving AveragesMoving Average Colour Mode– Colours the moving averages according to the mode:Flow
Bias
Colour Background According to Long/Short Bias– Colours the background accordingly.
DISPLAY
Compression of Moving Averages– Highlights whether the moving averages are close to each other. “Close” is determined algorithmically depending on the lengths configured for the moving averages.Break Lines Needed for Signals– If an MFP setup is active, this setting shows you the price level that is needed in order to trigger it. Sometimes there is no MFP setup active because momentum hasn’t been strong enough to create one yet.Bias Change Label– Draws a label showing what has to happen in order for the current bias to flip. This could be an MFP, in which case it tells you the price level needed. It could be an MA flip, in which case the price is undetermined, but you can get an idea by looking at the MAs.Label Offset– How far to the left of the current bar theNext Change Labelis drawn.Round Break Line Prices To:– If checked, the prices displayed on theNext Change Labelare rounded to the number of significant figures (not decimal places) that you choose. This feature alone took me a couple of days to code, as it’s not native to Pinescript 😆[Bias Add-On only] Show Current Timeframe– If checked, prints the timeframe that is currently being used by the indicator over the coloured background.[Bias Add-On only] Spacing for Printing the Current Timeframe– How many bars apart the text is printed. If the indicator is set to a much higher timeframe than the chart, you probably want to decrease this setting.
COLOUR
Background Transparency– Custom transparency for the background bias, if displayed.Tight MA Transparency– Custom transparency for the tight EMA highlight, if displayed.Bullish, Bearish Colour– The bullish and bearish colours. The colours for the background, the moving averages, the MA compression highlights, the signal text, and the break lines are derived from these.Override Text Colour for Signals– Depending on your chart background colour and the bullish and bearish colours you choose, you might want to fix the signal text colour for better visibility. Set toOffto inherit the bullish and bearish base colours.[Bias Add-On only] Timeframe Text Colour– The colour of the text that shows the current timeframe. Because of some limitations in the current version of Pinescript, there’s no other way to allow users to set this colour.
ADVANCED
The default values are good. Change them if you know what you’re doing.
Shortest MA Length– The length of the shortest moving average in the set of five. The three middle moving averages are auto-generated to approximate a Fibonacci sequence. The difference between the shortest and longest moving average lengths must be at least 15 in order to generate a meaningful set.Longest MA Length– The length of the longest moving average in the set.Fractal range back– How many bars back to measure for the range used to find significant local levels. The effects of changing the defaults can be complex, but in general, smaller numbers tend to give more and quicker entries, while larger numbers avoid false signals but can come late.Fractal Range Forwards– How many bars forward to measure for the range used to find significant local levels..Counter-Trend Timeout– A Counter-Trend signal must be confirmed by a trend change within this many bars or else it is cancelled. The default of 20 prevents too many changes. If you want a more responsive setting, try something like 10.Ignore First Bar– Exclude the very first bar from calculations. This can be useful for crypto, where the very first transactions on listing can be at wildly variant prices, causing errant moving average values.
Alerts
Before using the alerts, familiarise yourself with the different alert options built into TradingView, especially those to do with whether an alert triggers during a bar or on close.
The following alert conditions are included in Counter-Strike Pro. They don’t depend on which signals are selected for display.
Bias Flip Long: The long/short bias changes from short to long.Bias Flip ShortLong MFP: A long Momentum Failure Pattern occurs.Long MFP Cancelled: A long Momentum Failure Pattern is cancelled.MA Compression StartsMA Compression Stops: The moving averages have expanded out of a compressed state.MAs Flip Bearish: The moving averages enter bearish flow.MAs Flip BullishShort MFP: A short Momentum Failure Pattern occurs.Short MFP Cancelled: A short Momentum Failure Pattern is cancelled.
How to get it
There is no free version of this tool. This is my own unique creation (not just a mishmash of things other people invented) and my first paid script (all the others so far I’ve given away). It cost me months of research, coding, and testing. It costs you a small fraction of that.
The current price of this indicator is $99 for a perpetual licence (you get both Counter-Strike Pro and the Bias Add-On). I take Paypal or any major crypto. Just send me a message and I’ll sort you out.
In order to decide if it fits for you, you can request a free trial (be sure to include the name of the indicator and your exact TradingView username).
For reference, here is the script page on TradingView for Counter-Strike Pro and the Bias Add-On.
Support and questions
For any questions about using this indicator that are not answered on this page, to report a bug, or to give negative or positive feedback, please leave a comment on the script page on TradingView (so that everyone can see whether it’s proving useful to traders or not), or send me a message through the contact form on this website. If you message me directly on TradingView, and I’m in the middle of something else, which is always, I might read the message and then forget to ever respond. If you send me an email through the form, it stays in this inbox until I can deal with it.
In general, buying an indicator gives no claim on my time. You get access to the indicator in its current state and nothing else is implied. In terms of support, while I make no guarantees whatsoever, including that the TradingView platform or this script will continue to function as it does now, if you look at the script page on TradingView you can get an idea of how I’ve been supporting, fixing and improving this script up to now.
Credits
Thanks to my trading mentor and his Discord group for showing just how much understanding of the market is possible (and yet to be gained).
All code is my own.