What it does
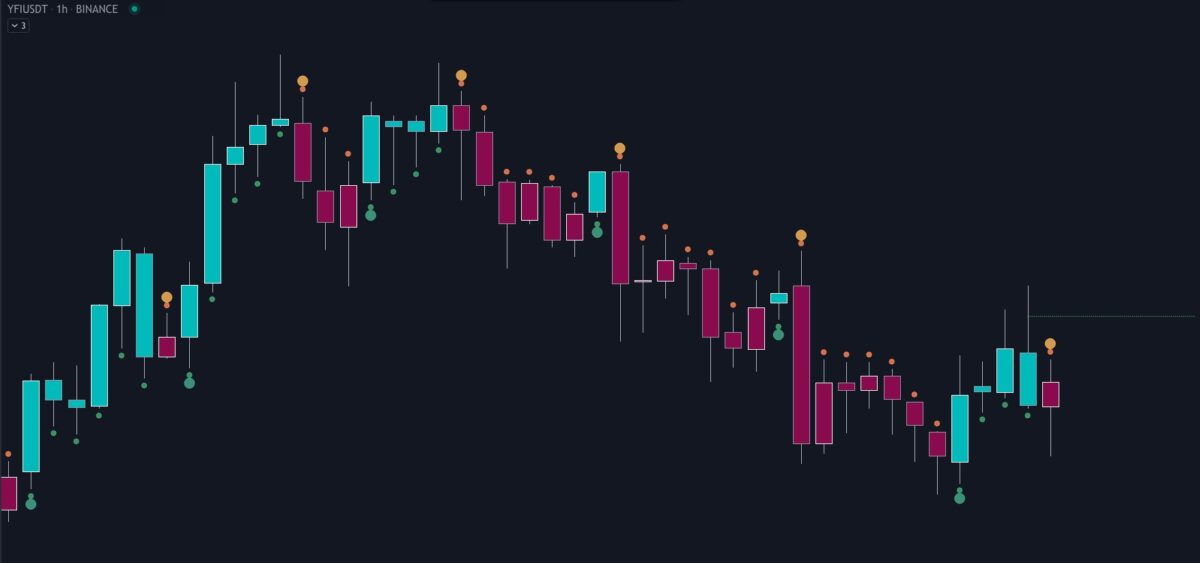
- Displays the Heikin Ashi candle direction on your normal chart
- Predicts the close needed for a change in Heikin Ashi direction
Heikin Ashi is a different method of calculating candlesticks. It has several advantages:
- It can help to show the dominant trend in a smoother way than normal candles.
- Flips in direction can show either trend reversal, or a pause and continuation, which can be a place to join a trend.
Disadvantages of using Heikin Ashi include:
- Having to change to a different chart layout
- Difficulties working directly with Heikin Ashi values, because the values of the Open, Low, High, and Close displayed are different to the “real” prices.
This indicator solves this problem by bringing trend information from Heikin Ashi candles (whether they’re bullish or bearish ) onto your normal candle chart. It displays in the main chart pane.
Why it’s great
It’s great because:
- You don’t have to change from your normal layout.
- You can see normal prices.
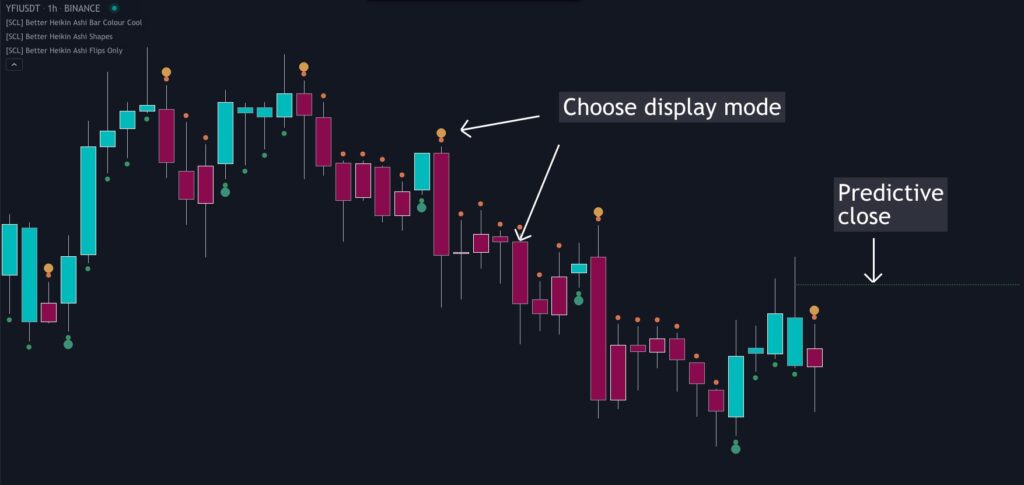
- You can use it alongside other indicators without clashing visually by choosing from includes different display modes (bar colour/plotted shapes/shapes on flip only)
Many scripts include some or other of these features; here I’ve included them all in one for flexibility.
One feature that, as far as I know, is unique is the “predictive close”, which shows you where the current candle needs to close in order to change the Heikin Ashi direction.
This indicator also has alert conditions included:
.Heikin Ashi Bull Flip: Alerts when the direction changes from bearish to bullish..Heikin Ashi Bear Flip: Alerts when the direction changes from bullish to bearish.
How to get it
Click this button from the script page on TradingView: ![]()
Limitations
It works on all markets and timeframes. This is an indicator, not a trading system, and it’s not intended to be used to generate entries and exits on its own.
How to trade with it
The main usage of this indicator would be to identify trends, as well as inflection points.
Settings
These are all the user-configurable settings and what they do.
Display Mode– How the Heikin Ashi bull/bear candle information is displayed on the chart:Bar Colour Classic– Colours the candle bodies red/greenBar Colour Cool– Colours the candle bodies with an alternate colour schemeShapes– Plots little shapes that represent the candle direction, above/below each candleFlips Only– Plots shapes only when the direction changesOff– Don’t display anything
Predict Real Close Needed to Flip Colour– Plots the real price at which the candle would need to close in order to change the Heikin Ashi direction. This shows you “how green” or “how red” the current candle is, that is, how far away it is from flipping. You can use this to decide whether you want to wait for the candle close or take a signal intra-candle. It doesn’t predict where price will go.
Support and questions
For any questions about using this indicator, or to report a bug, please leave a comment on the script page on TradingView rather than sending a message.
Technical details
This indicator does not repaint, meaning, it doesn’t go back and alter any bars in the past.
However, until a candle closes, the indicator can only use the current price as the “close”, and so the drawings, colours and warnings for the current candle will change as the price changes. Once the candle closes, they are fixed.
The “predictive close” can and must move, as the High, Low, and Close prices change throughout a candle. But it’s pretty accurate.