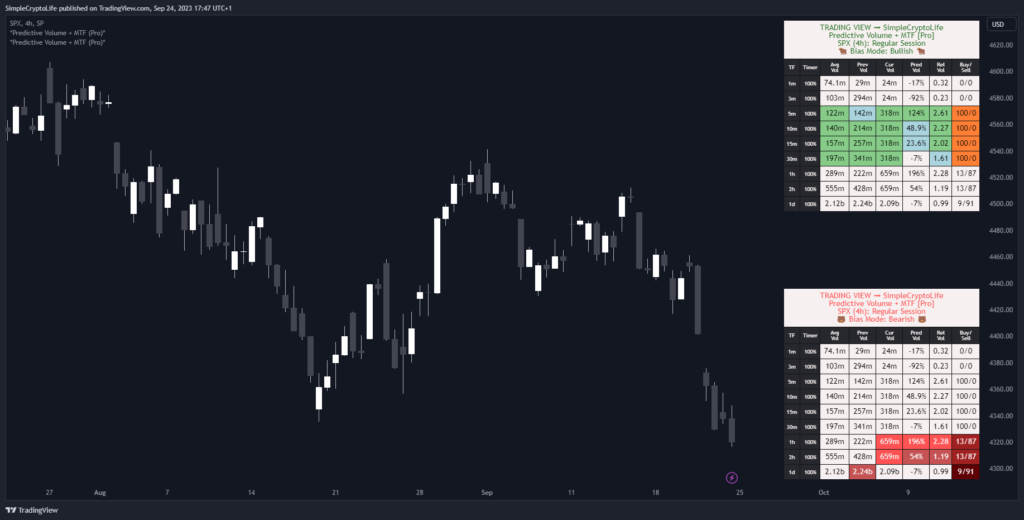
What it does
- Shows a table of volume metrics on the chart, higher, and lower timeframes all at once
- Includes the special metric Predictive Volume
- Makes it easy to use multiple timeframes (like the pros)
- Has built-in bias modes
- Includes powerful alerts
This is a unique indicator. It’s the brainchild of my buddy @MYNAMEISBRANDON and I helped to code it up.

Why it’s great
There are plenty of volume indicators available, both paid and free. But I don’t know of any that have this rich of a feature set:
- You can show/hide the timeframes you want
- It predicts what the volume of the current bar will be by its close
- You can choose which volume metrics are displayed:
- Time remaining in bar
- Average / Previous / Current Volume
- Relative Volume
- Buy & Sell Volume
- It has built-in bias modes that can highlight only bullish or only bearish metrics
- Built-in alerts use bearish or bullish values across multiple metrics
- You can create custom alerts and test them with live, interactive debug
- It has plenty of quality SimpleCryptoLife touches (more below)
Volume is a great confluence to whatever other indicators you may use, and this indicator is a good value way to get a detailed view of volume that other traders can’t easily replicate.
How to trade with it
Volume can be a powerful tool to choose which assets to trade, and to decide when to trade. The displayed Buy/Sell Volume can give you an idea of the market direction.
And, to get in at the beginning of a move, whether price is going up or down, you generally want a good amount of volume, and for it to be increasing. This leads to some questions:
How much volume is “a good amount”?
You could set a moving average on the default TradingView volume and look if and by how much volume is above or below it.
This indicator allows you to do this, in effect, over multiple timeframes at once.
It also allows you to set custom, complex alerts that include volume vs average as one of the conditions.
Is volume increasing…really?
This is not as obvious as it sounds. If the current bar is only part-way through, and it hasn’t yet breached some threshold, it could still be increasing relative to the previous bar, really. Do you need to wait for the close? Or to do some calculations? Not any more.
This indicator includes a special feature that estimates what the closing volume of the current bar will be, given the volume so far and how far through the bar we currently are. If the Predictive Volume is negative, the current bar’s volume is predicted to be lower than the previous one, and if positive, higher, by the displayed percentage. This means you can take action while the other fellow is still waiting for the bar to close.
It also displays the Relative Volume, a well known metric that compares current volume (in the bar so far) to the average.
And of course you can use both of these metrics in your own compound alerts.
Multiple timeframes
A big plus for this indicator as opposed to others is that you can see the same metrics for multiple timeframes at the same time. This gives you a birds-eye view into the asset’s volume as a whole.
Before you ask, no it does not repaint. All values are live. There is no historical data displayed, so there is nothing that can be changed after the fact. This is not a tool for historical analysis of volume. It’s a tool for seeing what’s happening to inform your trading decisions right now.
Bias is good
Trading bias, that is. As long as you have some technical reason to be looking for longs or shorts, you should have better results. It’s up to you what indicator or system you use for your bias, but once you have decided it, you can enable the corresponding bias on Predictive Volume Pro and it will only highlight metrics that point in that direction, thus making it much easier on the brain.
The bias options are:
Bullish: Highlights volume metrics in colours according to their bullishness.Bearish: Highlights only bearish metrics in varying shades.Standard: Highlights both bullish and bearish metrics in simple red and green.
Alerts
Predesigned alert conditions are included, as well as the facility to create your own.
Building alerts
Open the settings and scroll down to the ALERTS SETTINGS.
- Select a frequency for the alert.
Each Barfires as soon as the criteria are met.On Closefires only when a bar that meets the criteria closes. The close counts from the current timeframe. Even if you set an alert for the 1-day timeframe, if you set it from the 5-minute chart, it will fire at the end of a 5-minute bar. You can configure the alert from any timeframe but just remember to actually set it from the timeframe on which you want to define the “close”. - Choose the timeframes for which you want this alert to fire. You can enable as few or as many as you want. It probably makes sense to do one at a time, at least to start with, so you can give them unique names. If you select multiple timeframes, the alert will fire when the criteria are met on any of them.
- Choose one or more predefined alerts, or enable custom alerts. Again, you can select one or many alerts, and an alert will fire when any of them are hit.
Predefined alerts
The predefined alerts consist of 4 bullish and 4 bearish. They use thresholds across Buy/Sell, Predictive, Current vs Previous, and Current vs Average Volume. Level 1 is mildly bullish/bearish, up to Level 4 which is extremely bullish/bearish (the tooltips detail exactly what the conditions are).
Custom alerts
When you are comfortable with the metrics, you can create your own custom alerts.
Make sure the Enable Custom Alert box is checked, and choose your conditions. You can mix and match conditions across any of the metrics you can see in the table. Check the tooltips and the detailed descriptions of each setting below.
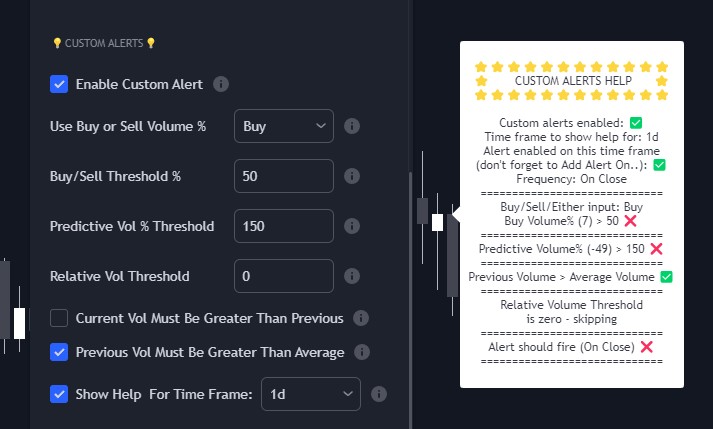
An incredibly useful feature I haven’t seen anywhere else is the interactive help. Select Show Help For Time Frame and choose a timeframe (although you can have the alert run across multiple timeframes, for reasons of space and sanity you can only test one at a time). A label appears, showing all the conditions that you chose, and whether they are currently met.

In the screenshot above of the alert settings and the corresponding help, you can see:
- Custom alerts are enabled, in general
- The timeframe for which help is shown is 1 day, and this timeframe is selected in the settings (further up; not shown)
- The Buy/Sell Volume criterion uses either Buy or Sell
- Neither Buy nor Sell Volume right now is greater than the threshold
- Predictive Volume right now is lower than the threshold
- Previous Volume is indeed greater than Average Volume
- The Relative Volume threshold (Current/Average) is set to zero, so this condition is not checked
- The alert will not fire, given current conditions (because not all criteria are met)
This help allows you to test whether your conditions are realistic, perhaps on a low timeframe, before creating an alert based on them.
How to actually set the alerts
Because the custom alerts, being massively configurable, go way beyond what is possible using the old TradingView alert framework, you set them up in the new way: by configuring the alert options in Settings and then choosing Add Alert on.. or pressing Alt-A. The Condition is by default set to the indicator and Any alert() function call. Leave that as it is, choose an expiration if you like, and give the alert a name. Click Create and that’s it. The alert is now created, using a snapshot of whatever you put in the settings.
Feel the quality
When you buy a new car, things like the way the door closes with a satisfying “clunk”, while not crucial to the way it drives, gives you a feel for whether the manufacturer has taken care of details. Just so, I hope the following little touches reassure you that the engineering of this script is high quality.
- You can switch between Regular and Extended sessions in the settings. This ensures that you get more accurate results.
- It works the same on regular candles as on non-standard candles such as Heikin-Ashi.
- The text for the top two headers is customisable.
- All the headers can be hidden.
- The bar timer can count up or down, in % or in days, hours, minutes, and seconds.
- All metrics are displayed to a number of significant figures that you can change.
- The table position and size can be changed.
- You can set a different length for the Average Volume for intraday, daily, weekly, and monthly timeframes.
- Alert messages are pre-populated with the conditions and values that triggered the alert.
Clunk!
How to get it
For all enquiries about obtaining and paying for the indicator, support and questions, send a message to the creator, @MYNAMEISBRANDON on TradingView.
The script page on TradingView is here: https://www.tradingview.com/script/hESCvPuH-Predictive-Volume-MTF-Pro/
Settings Reference
These are all the user-configurable settings and what they do.
TABLE HEADER SETTINGS
Trading Hours– Choose whether the current session is Regular or Extended (Pre-Market/After Hours). Set this correctly to get accurate results.Bias Mode– Choose which kind of metrics are highlighted:Bullish: Highlights volume metrics in colours according to their bullishness.Bearish: Highlights only bearish metrics in varying shades.Standard: Highlights both bullish and bearish metrics in simple red and green.
Header 1– Show/Hide and customise the top header.Header 2– Show/Hide and customise the subheader.Show Ticker, Time Frame & Trading Hours– Show/Hide the header that gives session, ticker, and bias information.
PREDICTIVE VOLUME TABLE SETTINGS
Bar Timer Mode– Choose to show time or percent.Bar Timer Direction– Show time remaining or time elapsed.Table Size– Controls the size of the table.Table Position– Controls the position of the table.Significant Figures– How many significant figures should the values be displayed to.
EXPAND OR COLLAPSE TIME FRAME ROWS
Choose which of the predefined timeframes are displayed. The table automatically resizes accordingly.
EXPAND OR COLLAPSE COLUMNS
Choose which metrics are displayed. The table automatically resizes accordingly.
Timer– How long is left to go in this bar.AvgVol– The average volume according to the Simple Moving Average length configured.PrevVol– The volume of the previous bar.CurVol– The volume of the current bar.PredVol– Predictive Volume. What volume the current bar is predicted to have when it closes.RelVol– The Relative Volume, i.e., Current Volume over Average Volume.Buy/Sell– The Buy and Sell Volume.
AVG VOLUME LENGTHS
Set the length of the Simple Moving Average calculation for the Average Volume for intraday, daily, weekly, and monthly timeframes. The values can be the same or different for each timeframe.
ALERTS SETTINGS
Alert Frequency– When the alert should fire.Time frames for predefined and custom alerts– Choose the timeframes in which alerts should fire.Predefined bullish alerts– Choose the level of bullish alerts, ordered in ascending bullishness.Predefined bearish alerts– Choose the level of bearish alerts, ordered in ascending bearishness.Custom Alerts– Define your own alert conditions. All conditions must be met for an alert to fire.Enable Custom Alert– If this is unchecked, all the following settings have no effect.Use Buy or Sell Volume– Define a condition on Buy Volume, Sell Volume, or both.Buy/Sell Threshold– The Buy or Sell Volume must be greater than this in order to fire the alert.Predictive Vol % Threshold– Predictive Volume must be greater than this in order to fire the alert.Relative Vol Threshold– Relative Volume must be greater than this in order to fire the alert. RelVol is measured as a fraction, not a percent, so, 1 is 100%.Current Vol Must Be Greater Than Previous– Adds this boolean condition to the alert.Previous Vol Must Be Greater Than Average– Adds this boolean condition to the alert.Show Help For Time Frame– Enables alert help for the specified timeframe.
That’s all, folks. Go buy it already.

