What it does
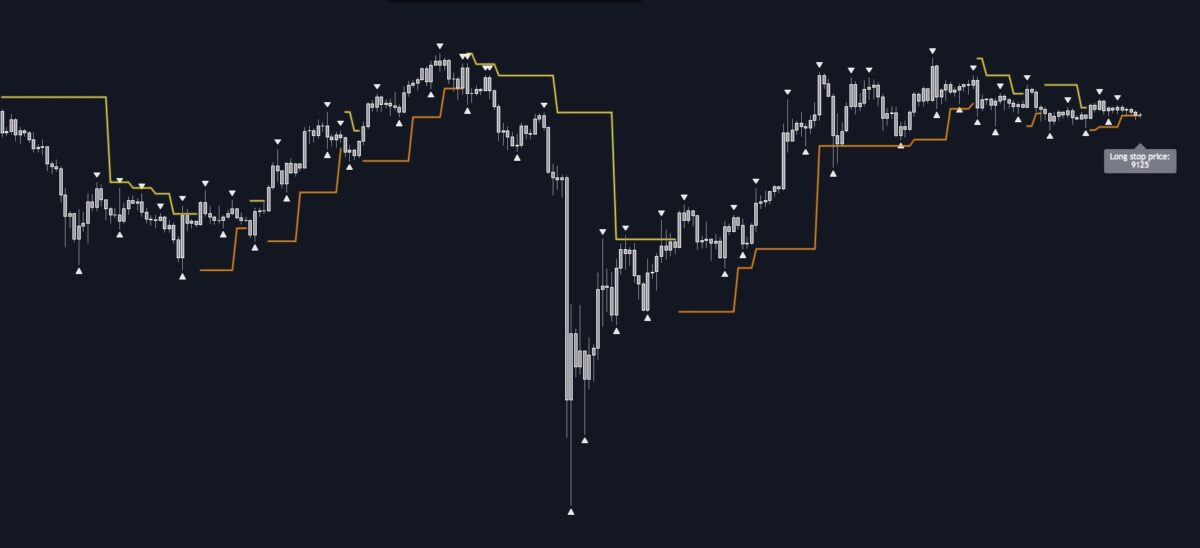
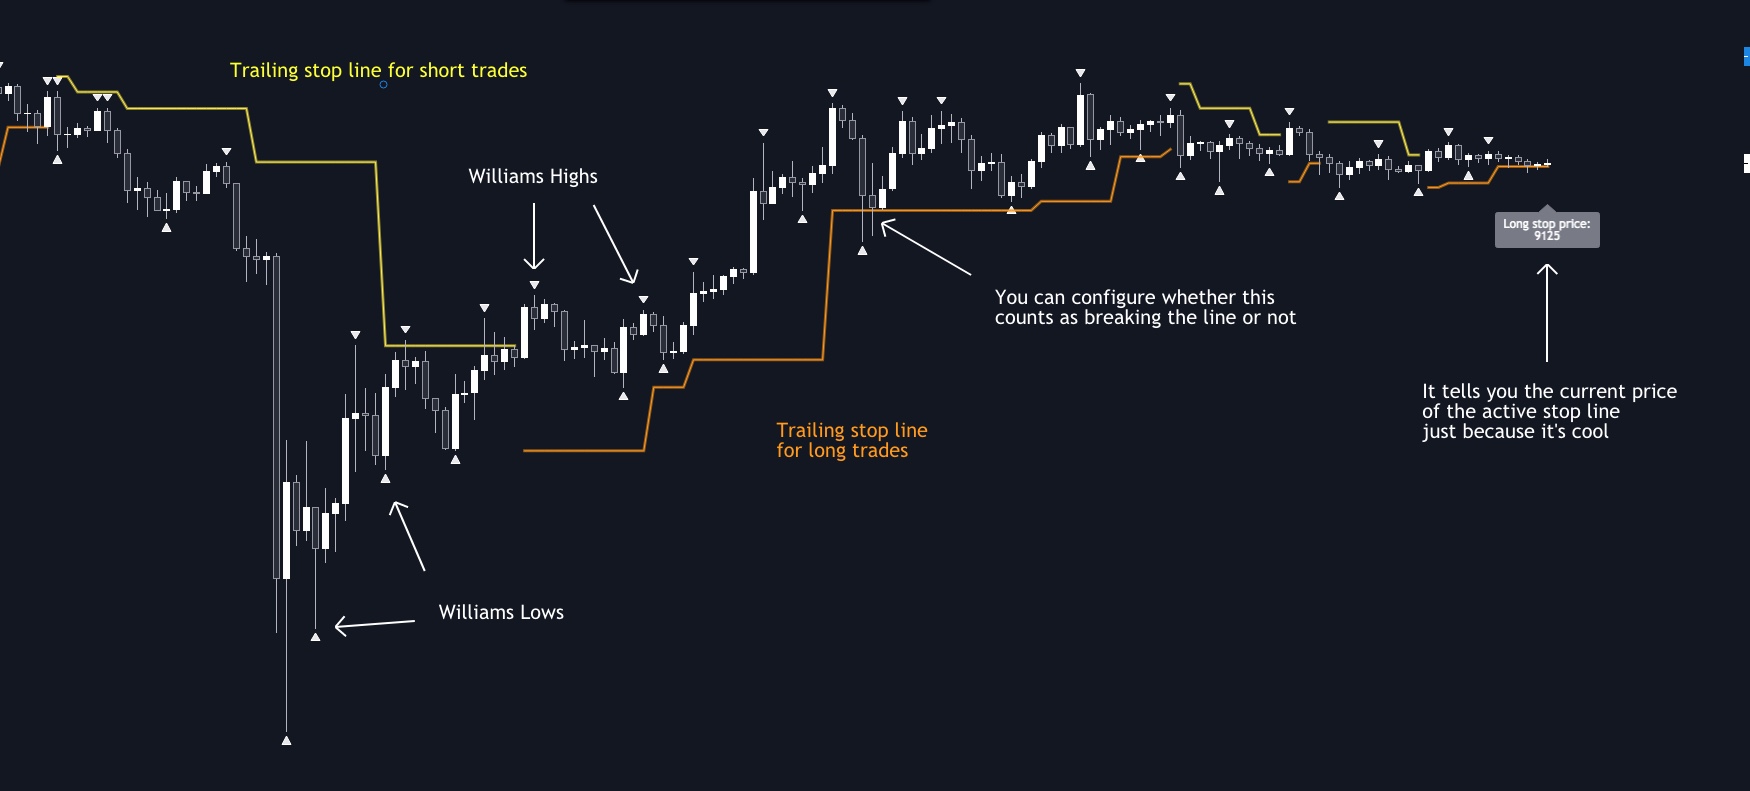
- Finds all Williams high and low fractals and marks them on the chart.
- Plots a stop line that trails the fractals up and down.
- Shows you when price goes against the prevailing trend.
Williams fractals are simply a way of measuring local highs and lows. They help you see market structure. They’re named after Bill Williams, who originated the idea.
Why it’s great
TradingView has its own built-in Williams Fractal indicator. My one has some advantages though:
- You can configure how many bars it takes to confirm a fractal. There’s nothing magical about two bars either side. Depending on your timeframe, you might get better results with different ranges.
- Includes a trailing stop line. The built-in version doesn’t have this. In fact I think mine is the only indicator with a Williams trailing stop line, at least it was when I released it.
- You can choose whether the trail flips long-short based on the price being exceeded by a candle wick or a candle close.
- It tells you the current price of the active stop line in a label, to make it easier to set your stop to it.
It also has alert conditions included:
Crossed Williams Long Stop: Alerts when the selected price source goes above an active long trail.Crossed Williams Short Stop: Alerts when the selected price source goes below an active short trail.
This indicator is open-source and heavily commented. I used functions for interesting parts like deriving Williams fractals, trailing values, and flipping long/short. If you want to create your own open-source script that does any of these things, you should be able to reuse the functions.
🏆 This indicator was featured as a “Best of the Month” script by TradingView, April 2020.
How to get it
Click this button from the script page on TradingView: ![]()
Limitations
This indicator deals only with Williams fractals and doesn’t get into other Williams indicators like the Alligator.
Technically, it works on all markets and timeframes, but it doesn’t make much sense on really small timeframes or on assets with very low prices for their denominations (like very low-sat cryptos).
This is an indicator, not a trading system, and it’s not intended to be used to generate entries and exits on its own.
How to trade with it
The main usage of this indicator would be to trail your stop under local lows (or a short stop above local highs). In this regard, it’s an alternative or complement to my ATR + Trailing Stops indicator.
You could also use it for confirmation that a movement of price is significant. If it hasn’t broken the opposing trail, you might consider that it’s not yet moved enough. For example, if you want to go long, but price hasn’t broken the short trail yet, it’s a reminder to be aware that price is yet to make a higher high.
Settings
These are all the user-configurable settings and what they do.
Show All Williams Fractals– Displays little triangles above/below each Williams fractal.Show Williams Trailing Stop– Displays a trailing stop based on the most recent fractal.Show Current Price of Williams Trailing Stop– Displays a price label for the current active stop.Buffer for Williams Stops %– Adds a buffer between the actual fractal price and the trail, as a percentage of the fractal price.Williams Fractal Range– How many bars in total are considered in order to confirm a Williams fractal. So, a range of 3 is the smallest and considers the previous bar and the next bar. A range of 5 considers the 2 previous bars and the 2 subsequent bars (counting the fractal bar, that’s 5). You could define the “range” differently, as being 1 in the first case and 2 in the second case.Flip Trail on– Defines which measurement of the candle (high/low, or close) must exceed the trail for it to flip.
Credits
Thanks to reading the highest()/lowest() function replacement script by the brilliant Ricardo Santos I finally understood why mine wasn’t working.
All code is my own.
Support and questions
For any questions about using this indicator, or to report a bug, please leave a comment on the script page on TradingView rather than sending messages.
Technical details
When a candle makes a high that is higher than the previous n (by default, two) candle highs, it’s a candidate for being a Williams high. It’s only confirmed, though, when the next two candle highs do not exceed it. And the same goes for lows.
Because Williams fractals can only be confirmed a number of bars after they form, this indicator must repaint – in the sense of going back to mark them once they’re confirmed. Because of this, TradingView will warn you that the indicator repaints when you set an alert. Don’t worry about it.
After a fractal has been confirmed and marked, nothing is altered in that bar or any of the previous bars.