What it does
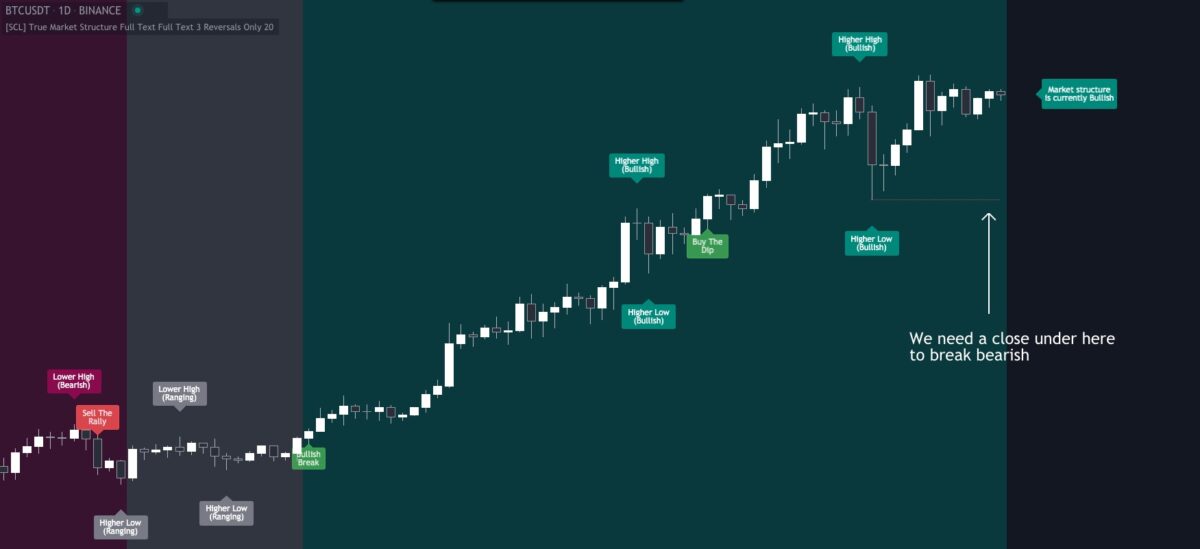
- Shows immediately whether market structure is bullish, bearish, or ranging
- Picks out Higher Highs, Lower Lows, etc.
- Alerts on changes to market structure
The point of knowing the market structure is to get the odds on your side – so you don’t make bullish bets in a bearish market and vice versa.
When price makes Higher Highs and Higher Lows, market structure is said to be bullish. When price makes Lower Lows and Lower Highs, it’s bearish. Simple, right? But in practice it’s easy to forget or to miscount. This indicator does the calculations for you.

Why it’s great
It’s great because:
- Unlike every other open-source script on TradingView (at the time of writing), it does not use simple Williams fractals as pivots. It actually calculates proper Local Highs and Local Lows. And it only allows a High to be confirmed after a Low and a Low after a High. That’s why I called it True Market Structure.
- By default, it’s colour-coded to interpret the current market structure for you.
- For those who don’t want to wait for an unpredictable number of bars for a High or Low to be confirmed, there is an optional faster signal: Bullish/Bearish Breaks in market structure.
- Another optional signal gives you high-potential entries: Buy The Dip highlights when a Higher Low is confirmed during an uptrend, and Sell The Rally shows a Lower High in a downtrend.
- It has multiple visual aids to show market structure, so you can use it alongside your other favourite indicators: colour the background, display a summary label, label every high and low, or just the most recent two.
All signals can be set as alerts:
.Lower Low: A Lower Low has been confirmed..Higher Low: A Higher Low has been confirmed..Higher High: A Higher High has been confirmed..Lower High: A Lower High has been confirmed..Buy The Dip: A Higher Low has been confirmed after a Higher High..Sell The Rally: A Lower High has been confirmed after a Lower Low..Bullish Break: Market structure is switching from bearish/neutral to bullish..Bearish Break: Market structure is switching from bullish/neutral to bearish.
Check the Limitations section below to understand on what bar different alerts will be triggered, and be mindful of what you set under the alert Options (Only Once, Once Per Bar Close, etc), in order to get the results you expect.
How to get it
It’s free. Just click this button from the script page on TradingView: ![]()
Limitations
Important: If you’re not seeing what you expect, check your settings and re-read this entire description carefully. Confirming Highs and Lows can get deceptively complex.
By definition, you only know that a Higher High etc has formed when it is confirmed, an unpredictable number of bars afterwards. Therefore, there’s a lot of repainting going on. Don’t worry. It’s still accurate.
HH, LH, LL, HL
These are all confirmed on close, after 1 or more bars. But the label is then applied retroactively, to the candle that was the actual High or Low. During a candle, the most recent label can appear and disappear as the current price changes. Once the candle is closed, the label (or lack of one) is fixed. You probably want to set alerts for these on close.
Breaks
Bullish and Bearish Breaks are confirmed on close. During a candle, the break label on the current candle can appear and disappear. Once the candle is closed, the label (or lack of one) is fixed. Breaks are fixed immediately the candle closes. They’re not retroactively applied to or removed from previous bars. You might want to get an alert for a break as it’s happening, before the candle closes, since they can often end up being large moves. Up to you.
Buy The Dip, Sell The Rally
These signals are shown on the candle that confirms the respective High or Low, not on the High/Low candle itself. They’re confirmed on close.
How to trade with it
These are not signals to be traded on their own. You still need a trade thesis. Use with support & resistance and your other favourite indicators. Works on any market on any timeframe. Be aware that market structure will be different on different timeframes.
Settings
These are all the user-configurable settings and what they do.
max_labels_count– The maximum number of labels displayed. This is hardcoded in the study declaration on line 3. If you want to look at market structure far back in a chart, you can increase it up to a system-enforced maximum of 500.Display Local Highs and Lows– Displays labels for Higher Highs, Lower Highs, Lower Lows, and Higher Lows.Keep Only Most Recent High & Low Label– Deletes previous labels after the current labels are confirmed on close.Display Current Market Bias Label– Shows or hides the current bullish/bearish/ranging bias.Show Breaks in Market Structure– Show when market structure breaks from Bearish or Ranging to Bullish, or from Bullish or Ranging to Bearish. “Reversals Only” shows only those breaks that signal a change from a bullish to bearish market structure or vice versa, i.e. when the market reverses. “All” also includes breaks out of a ranging structure back into the same direction as previously, i.e., continuations and reversals.Show Close Needed to Break Market Structure– Draw lines that show where price needs to close in order to flip market bias to bullish or bearish.Show Buy The Dip, Sell The Rally– Highlights when a Higher Low is confirmed after a Higher High, or a Lower High after a Lower Low.Force Confirmation of Highs & Lows After N Bars– When you get a range of inside candles after a big candle, you can wait a long time for a true confirmation. While you’re waiting, high or low wicks can happen that might not later be counted as Highs/Lows even though they look like they “should”. This setting stops waiting for a confirmation on higher/lower close and just confirms the fractal after a certain number of bars, which can also cause its own distortion. There might not be a perfect solution, but the default settings work just fine almost all the time.▻▻▻ Number of Bars– The number of bars after which to force confirmation. Using a high number, like 20, will not change much; it’s like insurance against any unusually long ranges. Using a low number will significantly increase the number of Highs and Lows displayed. It makes the indicator behave a bit more like other “pivot”-based indicators.
Credits
The rules for Local Highs and Lows come from my trading mentor. All code is my own.
Support and questions
For any questions about using this indicator, or to report a bug, please leave a comment on the script page on TradingView rather than sending messages.
Technical details
To confirm a candle as a Local High, you need a later candle to Close below its Low. To confirm a Local Low, you need a Close above its High. Higher Highs are bullish and Lower Lows are bearish, and I’ve defined the in-between Highs and Lows as “Ranging”, meaning, neutral. They could be trend continuation or reversal.
A Bullish break in market structure is when the Close of the current candle goes higher than the previous Local High. A Bearish Break is when the Close of the current candle goes lower than the most recent Local Low. I chose to use Close rather than High to reduce edge case weirdness. You can get live warnings by setting the alert to Options: Only Once, because during a candle, the current price is taken as the Close. Breaks are like early warnings of a change in market bias, because you’re not waiting for a High or Low to be formed and confirmed.
Buy The Dip is a label I gave to the first Higher Low in a bullish market structure. Sell The Rally is the first Lower High in a bearish market structure. These might be good buying/selling opportunities, but you still need to do your own analysis to confirm that.