What it does
This script shows the prevailing trend, striking a balance between being responsive and keeping you in a trend.
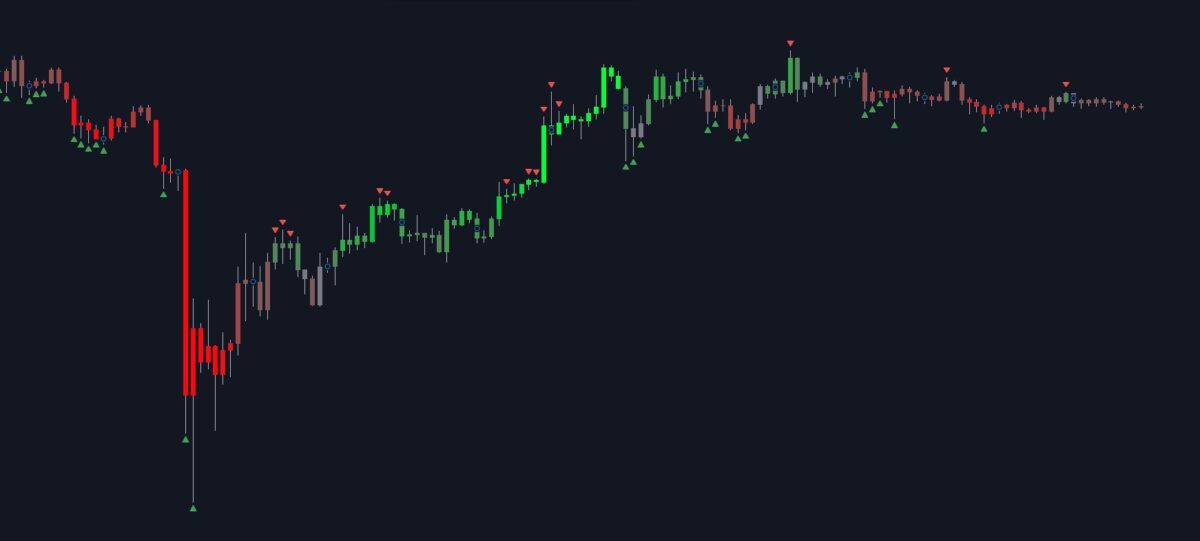
- Shows the direction and strength of the trend clearly colour-coded.
- Shows overbought and oversold, derived from the same data.
It works based on a unique measure of the rate of change of price action that I created.
Why it’s great
It’s self-adjusting:
- The trend strength measurement adapts dynamically to any market conditions.
- The overbought/oversold conditions are not hardcoded (like RSI 70/30), but have two layers of short- and long-term adaptation to auto-adjust over time to even the craziest of bull or bear markets.
I often forget this because the settings out-of-the-box work very well for all kinds of assets, but it is also configurable. You can tweak the trend and overbought/oversold settings to suit your asset and style.
It works differently to RSI as an overbought/oversold indicator:
- Prices don’t stay overbought or oversold for long periods of time.
- It’s quicker to catch the start of a trend change.
It has advantages over Heikin-Ashi candles for trend analysis:
- It can get you into trends earlier, or it can keep you in trends and avoid being shaken out (depending how you configure it).
- It uses regular candle values, so you can see the real prices right there on the chart, for stop losses etc. And you can read the candle shapes more easily.
How to get it
Click this button from the script page on TradingView: ![]()
Go Pro
The paid version of this free script, Price Action Trend Overlay | Pro, will be released on its own. It will also be included as a component in other scripts, such as Behemoth | Pro. Pro features include:
- Alerts when trend changes to bullish or bearish.
- Alerts on overbought/oversold conditions.
- Alerts when price comes out of overbought/oversold condition (for better reversal signals).
- Option to turn the overlaid colours off (so as not to conflict with other indicators).
- Choose the Trend Mode:
Average(general-purpose, and the same as the Simple version), orMax/Min, which gives more stable signals during a candle and is better for automation. - Advanced tuning options.
Check out Price Action Trend Overlay | Pro and Behemoth | Pro.
Limitations
It works on all markets and timeframes.
It has the same limitations as all trend analysis tools – trends can start and end unexpectedly. They can also get lost in ranging or choppy periods.
How to trade with it
This is actually my favourite indicator. I use it for every trade, so I’m a little surprised it’s not as widely adopted as some of my other indicators. I suggest you add it to your chart and live with it for a bit to get used to it. It has some differences to other indicators.
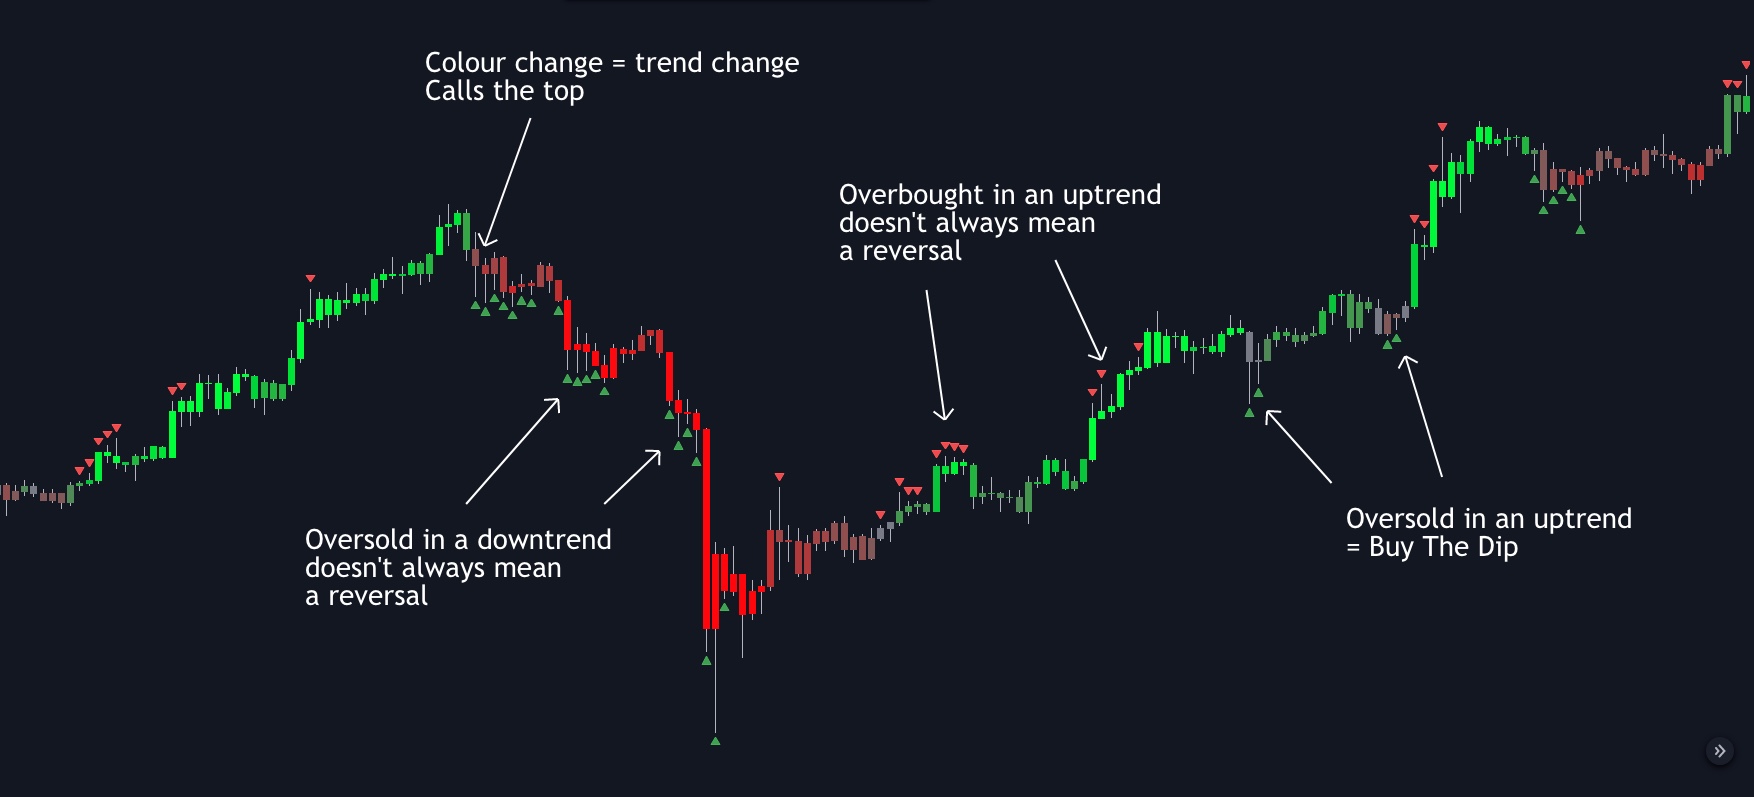
You could use a change from red to green or vice-versa as an entry, and stay in for as long as the trend goes your way.
You could use overbought in an uptrend (or oversold in a downtrend) as a signal to tighten trailing stops.
You could use oversold in an uptrend (you need some other confirmation that it’s still an uptrend!) to buy the dip, and overbought in a downtrend to sell the rally.
But don’t trade blindly on these signals alone. Use with market structure, support & resistance, and your other favourite indicators.
For any given asset and set of market conditions, you’ll want to check which timeframe picks out tops and bottoms the best. For example, in a screaming bull trend, you will be waiting a while for a daily oversold condition; you would rather look at a 4H or 2H oversold if you want a quicker entry.
Settings
💡 To get the candles looking like the screenshot, right-click the chart background, click Settings > Symbol and uncheck Borders.
These are all the user-configurable settings and what they do.
Trend Lookback Period– The numbers of bars back to include price action. Higher is smoother and less reactive.Trend Colour Mode–Classicis red/green/grey.Gradientis a colour gradient according to graduated trend strength.Trend Upper Neutral Threshold– Defines the upper bound of a zone where trend strength is considered neither bullish nor bearish. Set to to 50 to disable.Trend Lower Neutral Threshold– Defines the lower bound of a zone where trend strength is considered neither bullish nor bearish. Set to to 50 to disable.Show Overbought & Oversold– Flags each bar where price action is overbought or oversold with little triangles.Overbought/sold Lookback Period– Lower values help pick local tops and bottoms within the overall trend for swinging.Overbought/sold Adaptive Length– How quickly the overbought/sold threshold adapts to extreme moves and quiet periods. The lower the number, the more adaptive. A very high number approximates a simple average of all peaks/troughs.
Credits
The idea for using SSMAs to create a price action channel came from The Maestro @TrueCrypto28’s YouTube video Anatomy of a Trade. All code is my own.
Support and questions
For any questions about using this indicator, or to report a bug, please leave a comment on the script page on TradingView rather than sending messages.
Technical details
This indicator does not repaint, meaning, it doesn’t go back and alter any bars in the past. However, until a candle closes, the indicator can only use the current price, and so the overbought/oversold conditions and trend colours for the current candle will change as the price changes. Once the candle closes, they’re fixed.
The overbought/sold calculations use Williams Fractals, which by definition cannot be known until some bars afterwards. However, each new Williams Fractal only affects calculations in the future, not the past.