
What it does
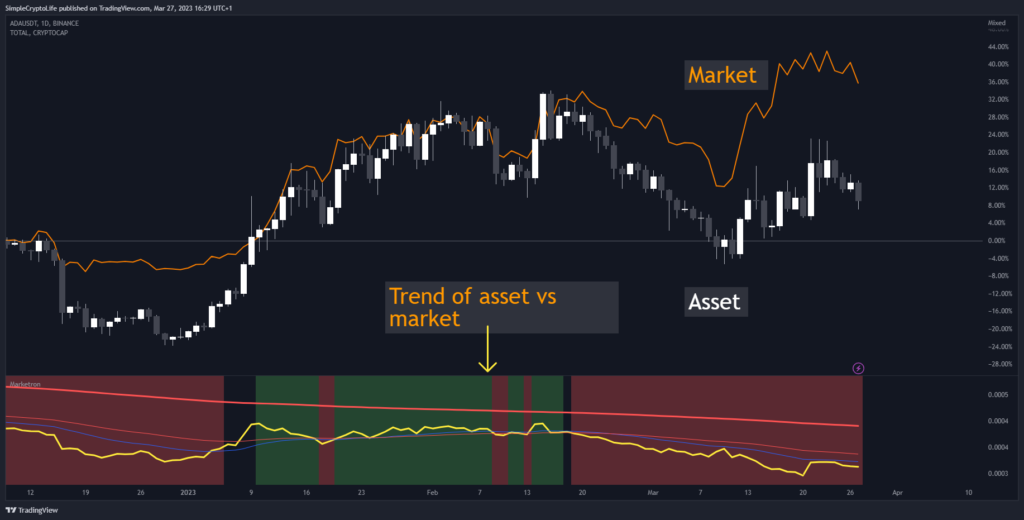
- Shows you how the asset on the chart is trending versus the market.
- Displays moving averages and a simple red/green bias.
You could do this yourself by typing, e.g., ADAUSDT/TOTAL into the asset box in TradingView and adding some EMAs manually and then interpreting them by eye. There’s no hidden technology in this indicator. It just makes it a lot easier.
In the example below, you can see that even though ADA is trending up in the last part of the chart, it is still underperforming the market (Bitcoin, the main component of the market weighting, was trending up faster).
Why it’s great
It’s great because:
- You can customise the market that it uses.
- There are some common markets programmed in as options.
- You can choose some more powerful bias options.
How to get it
Click this button from the script page on TradingView: ![]()
Limitations
It works on all markets and timeframes. You might not be able to use it at resolutions lower than one day, however, depending on the level of your TradingView plan; that’s a restriction from TradingView’s side.
How to trade with it
You can use it to see how an asset is performing relative to a basket of similar assets. For example, is Acme stock going up faster than the S&P, or slower.
If you compare an altcoin against Crypto All (TOTAL), then it can tell you whether that alt is outperforming the rest of the market; if not, you should probably be rather trading Bitcoin.
Settings
These are all the user-configurable settings and what they do.
Market (Auto)– Choose from various preselected markets.Market Ticker Manual Override– You can type in the ticker for your market if it’s not in the list. If you do, it overrides the Auto list.Show Classic EMAs– Show customisable Exponential Moving Averages.Bias Mode– Derive the red/green bias from whether price is above/below the Classic EMAs, or from a custom EMA function, or both.Show Bias Background– Colour the background, or not, with the directional bias.EMA 1 Length (smallest)– The length for the smallest EMA.EMA 2 Length– Length for the second EMA.EMA 3 Length– Length for the third EMA.
Support and questions
For any questions about using this indicator, or to report a bug, please leave a comment on the script page on TradingView rather than sending a message.
Technical details
This indicator does not repaint, meaning, it doesn’t go back and alter any bars in the past.
However, until a candle closes, the indicator can only use the current price as the “close”, and so the drawings, colours and warnings for the current candle will change as the price changes. Once the candle closes, they are fixed.