What it does
- Identifies extreme selling by Bitcoin miners, indicating profit-taking or capitulation.
- Generates signals based on on-chain metrics (miner selling vs reserves).

Why it’s great
It’s great because:
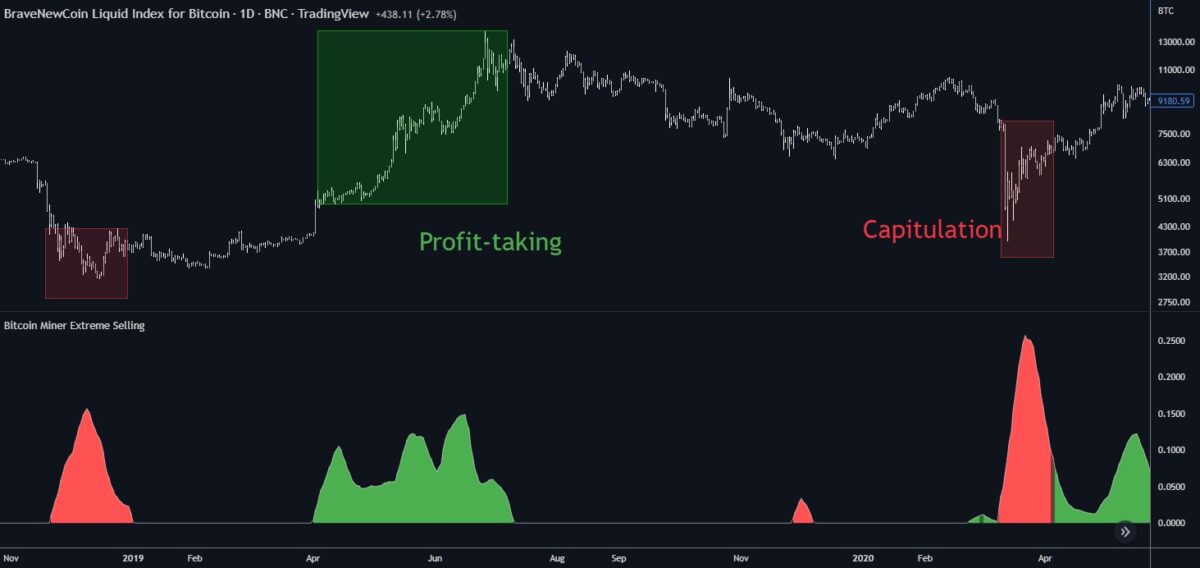
- The default view shows simple red (forced selling) or green (profit-taking) peaks.
- The height of the peaks shows you the relative degree of the selling vs a historical (200-day exponential) average.
- You can drill in to metrics based on BTC (for forced selling) or USD (for profit-taking) to compare historical heights more accurately.
- It’s based entirely on on-chain metrics, so can be used alongside price as confluence.
It’s inspired by the Bitcoin Miner Sell Pressure indicator by capriole_charles, and is, I think, an improvement:
- The rolling time period is configurable.
- It has fewer false signals.
- It’s simpler to use, in the default view, and has more detail, in BTC or USD modes.
There are no alert conditions included, because the nature of summing over weeks means that accuracy to the day doesn’t make sense.
How to get it
It’s free. Just click this button from the script page on TradingView:

Limitations
Only works for Bitcoin. It only makes sense to display this indicator on a daily chart. Because of the long-term moving averages, the length of the chart does make a difference to the output. I recommend running the script on the longest Bitcoin chart, ticker BLX .
How to use it
The main usage of this indicator would be as a warning that a steep rise in Bitcoin might be coming to an end, or that a big downcycle might have finished, as judged by Bitcoin miners. It might also be useful to those thinking of investing directly in Bitcoin mining companies, as it uses data directly from the miners.
Spend a few minutes looking over the whole history of Bitcoin with this indicator and see what you think the correlation is.
To use it to compare selling with e.g., pivots in crypto equities, use a split chart: one BLX with the indicator applied, and one with the equity of your choice. Sync Interval, Crosshair, Time, and Date Range, but not Symbol.
Settings
These are all the user-configurable settings and what they do.
Rolling Time Basis– Determines how much data is rolled up. At the lowest level, daily data is too volatile. If you choose, e.g., 1 week, then the indicator displays the relative selling on a weekly basis. Longer time periods, obviously, are smoother but delayed, while shorter time periods are more reactive. There is no “real” time period, only an explicit interpretation.Show Data > Outflows– Displays the relative selling data, along with a long-term moving average. You might use this option if you want to compare the “real” heights of peaks across history.Show Data > Delta– The default. Only the difference between the relative selling and the long-term moving average is displayed, along with an average of *that*. This is more signal and less noise.Base Currency– Configure whether the calculations use BTC or USD as the metric. This setting doesn’t use the BTC price at all; it switches the data requested from INTOTHEBLOCK.- If you choose Composite (the default), the script combines BTC and USD together in a relative way (you can’t simply add them, as USD is a much bigger absolute value). In Composite mode, the peaks are coloured red if BTC selling is higher than USD, which usually indicates forced selling, and green if USD is higher, which usually indicates profit-taking. This categorisation is not perfectly accurate but it is interesting insomuch as it is derived from block data and not Bitcoin price.
- In BTC or USD mode, a gradient is used to give a rough visual idea of how far from the average the current value is, and to make it look pretty.
Credits
Thanks to capriole_charles for the Bitcoin Miner Sell Pressure indicator, which inspired this one.
All code is my own.
Support and questions
For any questions about using this indicator, or to report a bug, please leave a comment on the script page on TradingView rather than sending messages.
Technical details
For the Pinescripters, I’ve commented everything.